Project Title:
UAE Economy at a Glance – 2018 Infographic Series
Role:
Graphic Designer, Researcher & Data Visualizer
Project Overview:
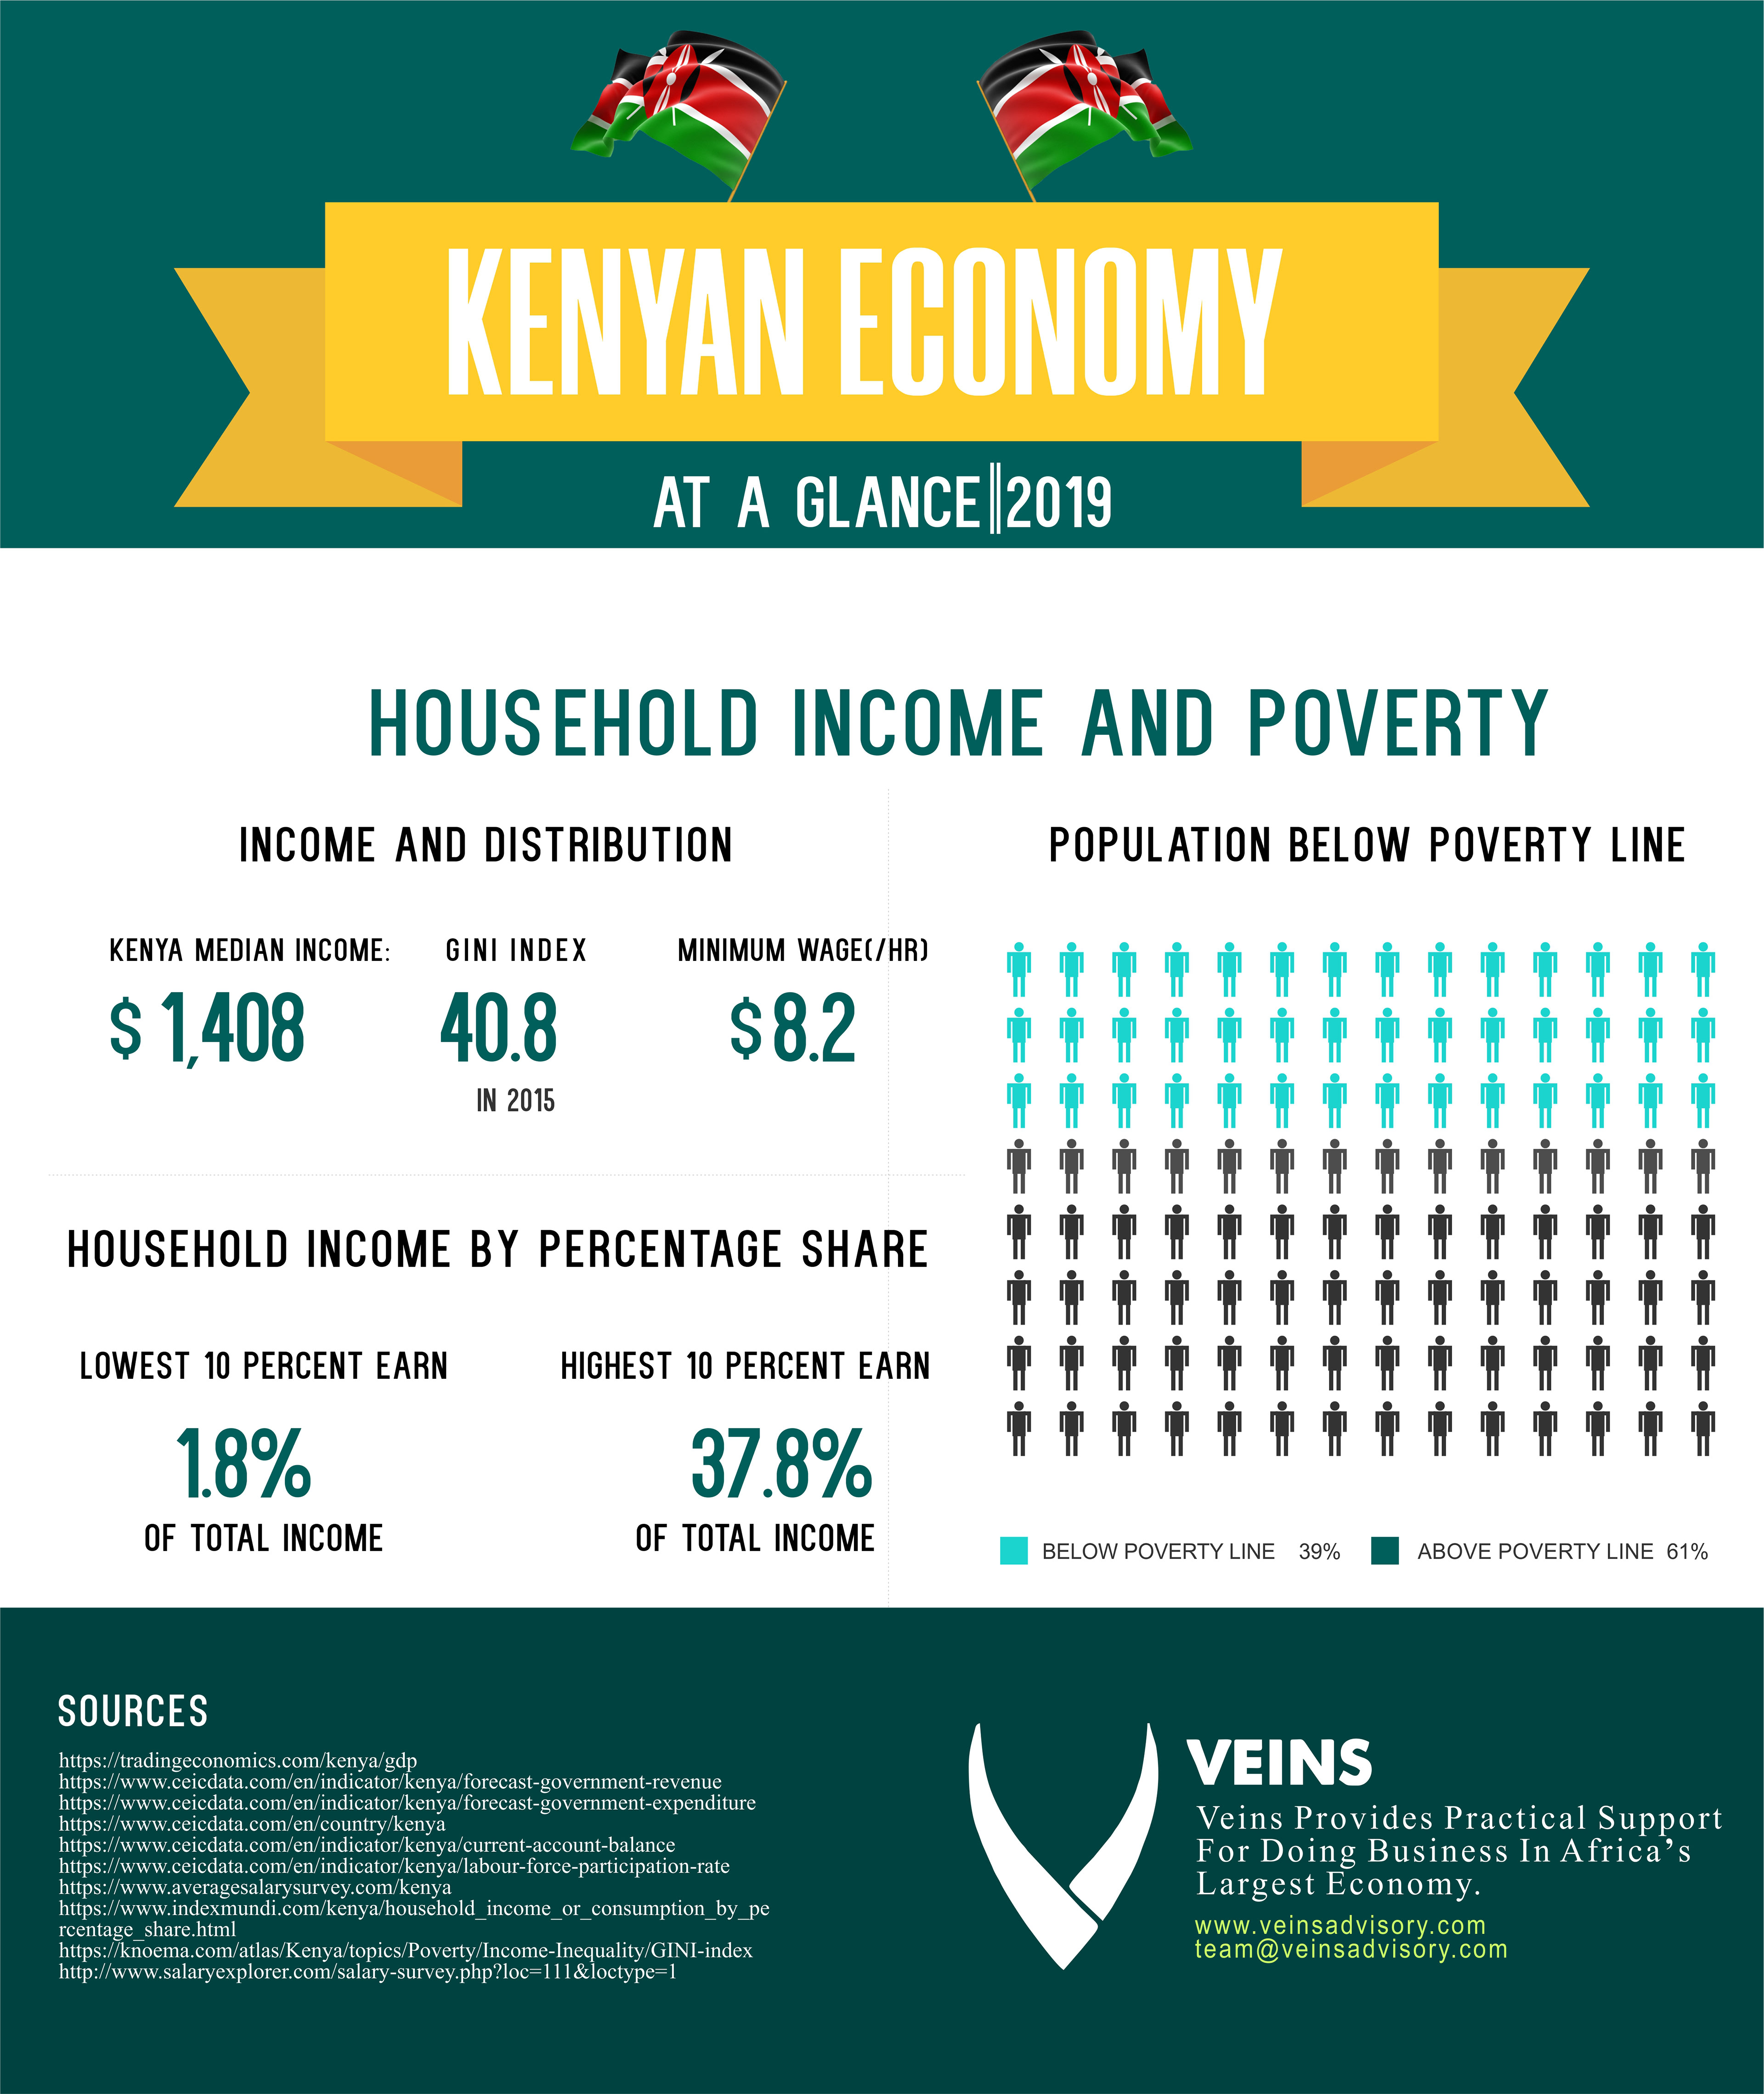
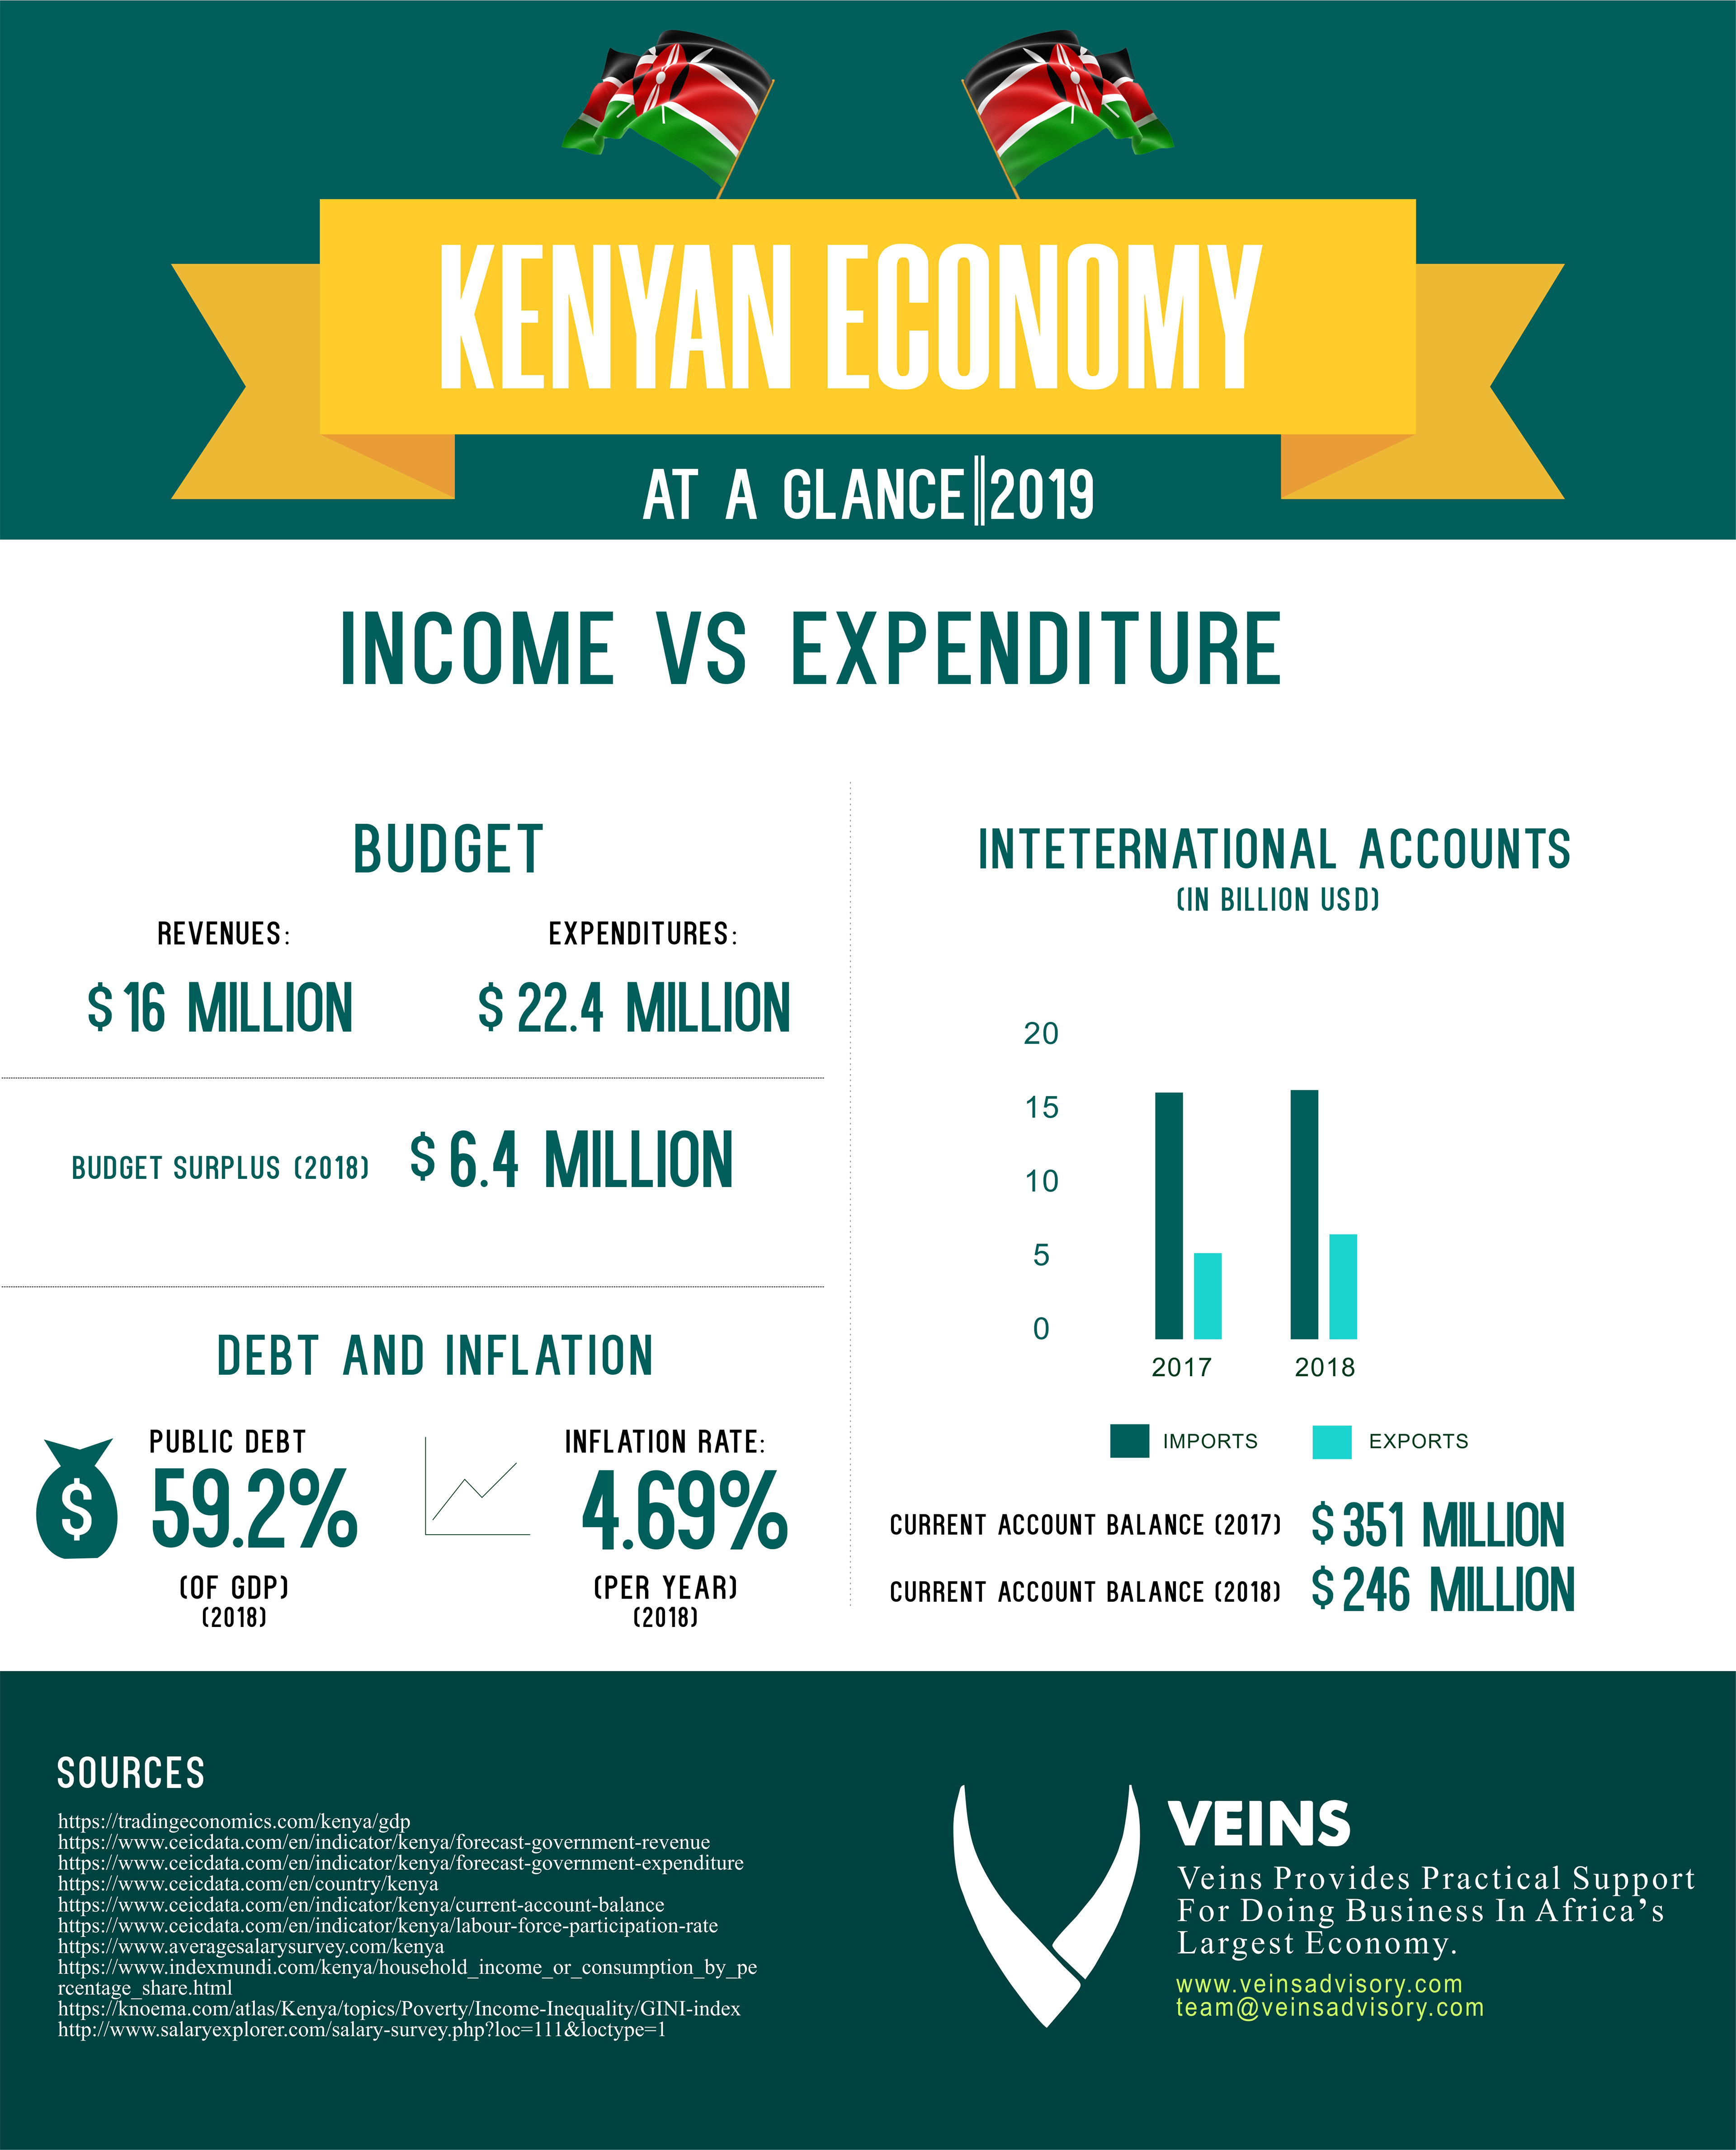
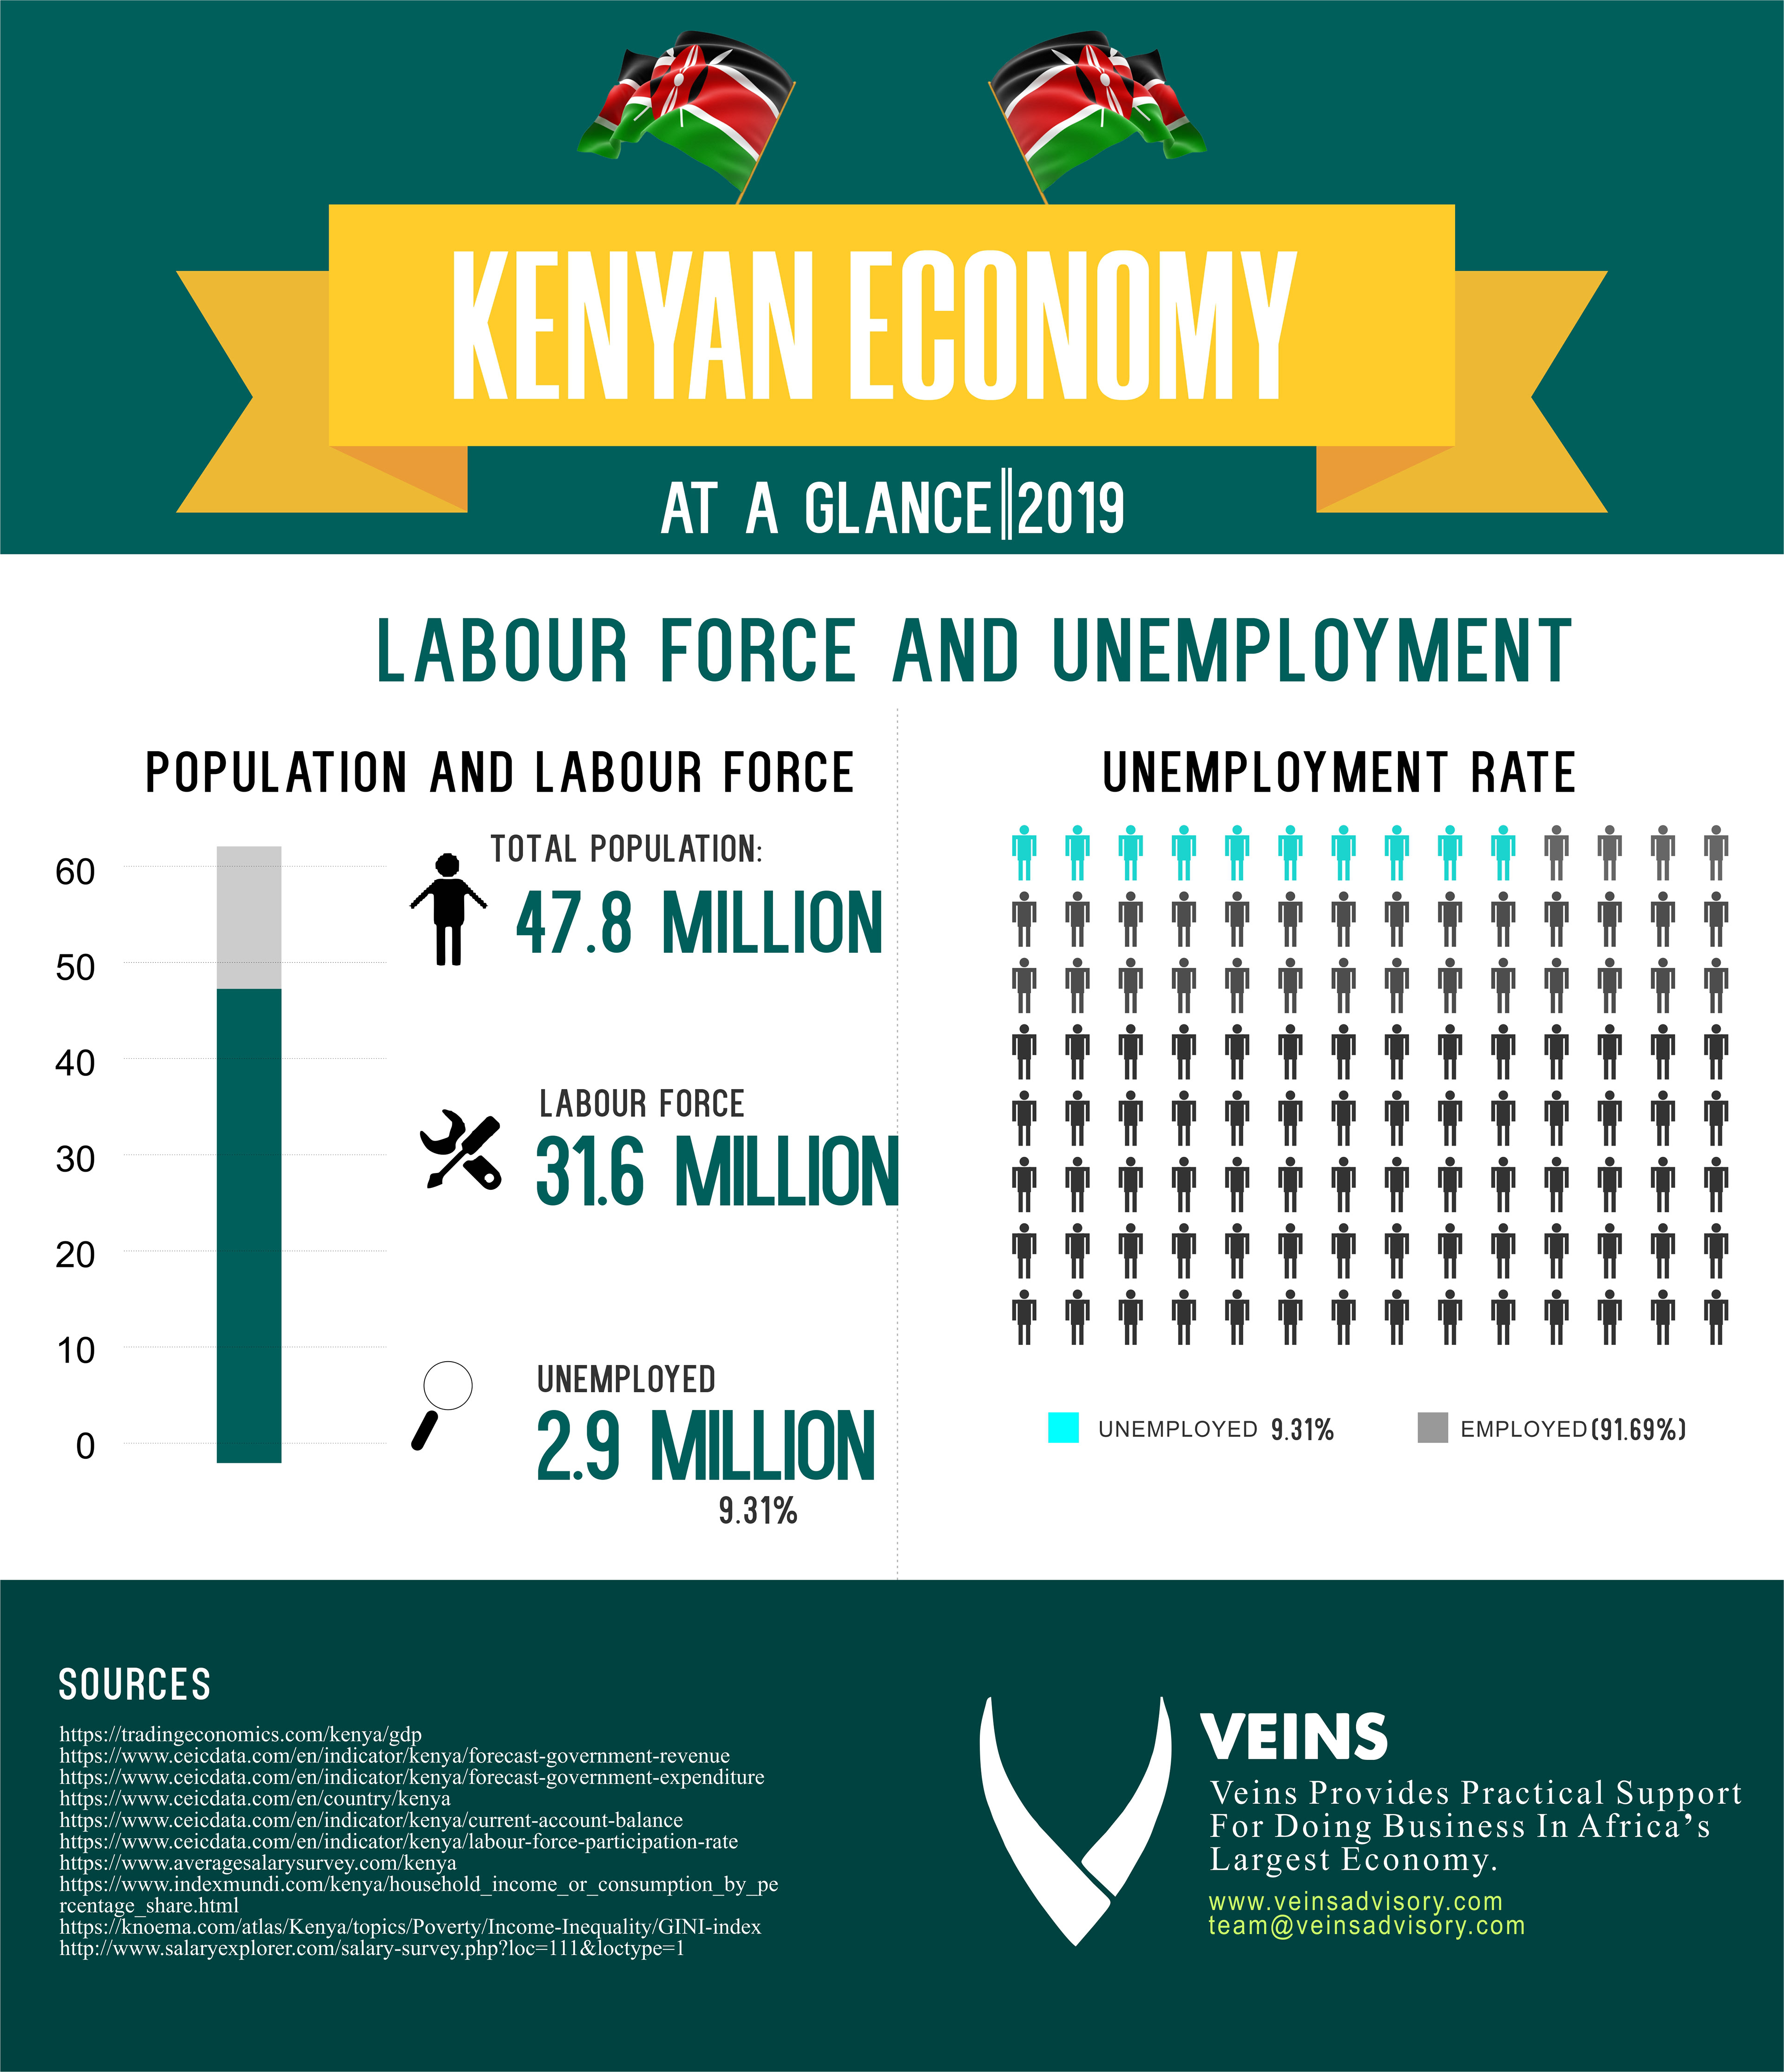
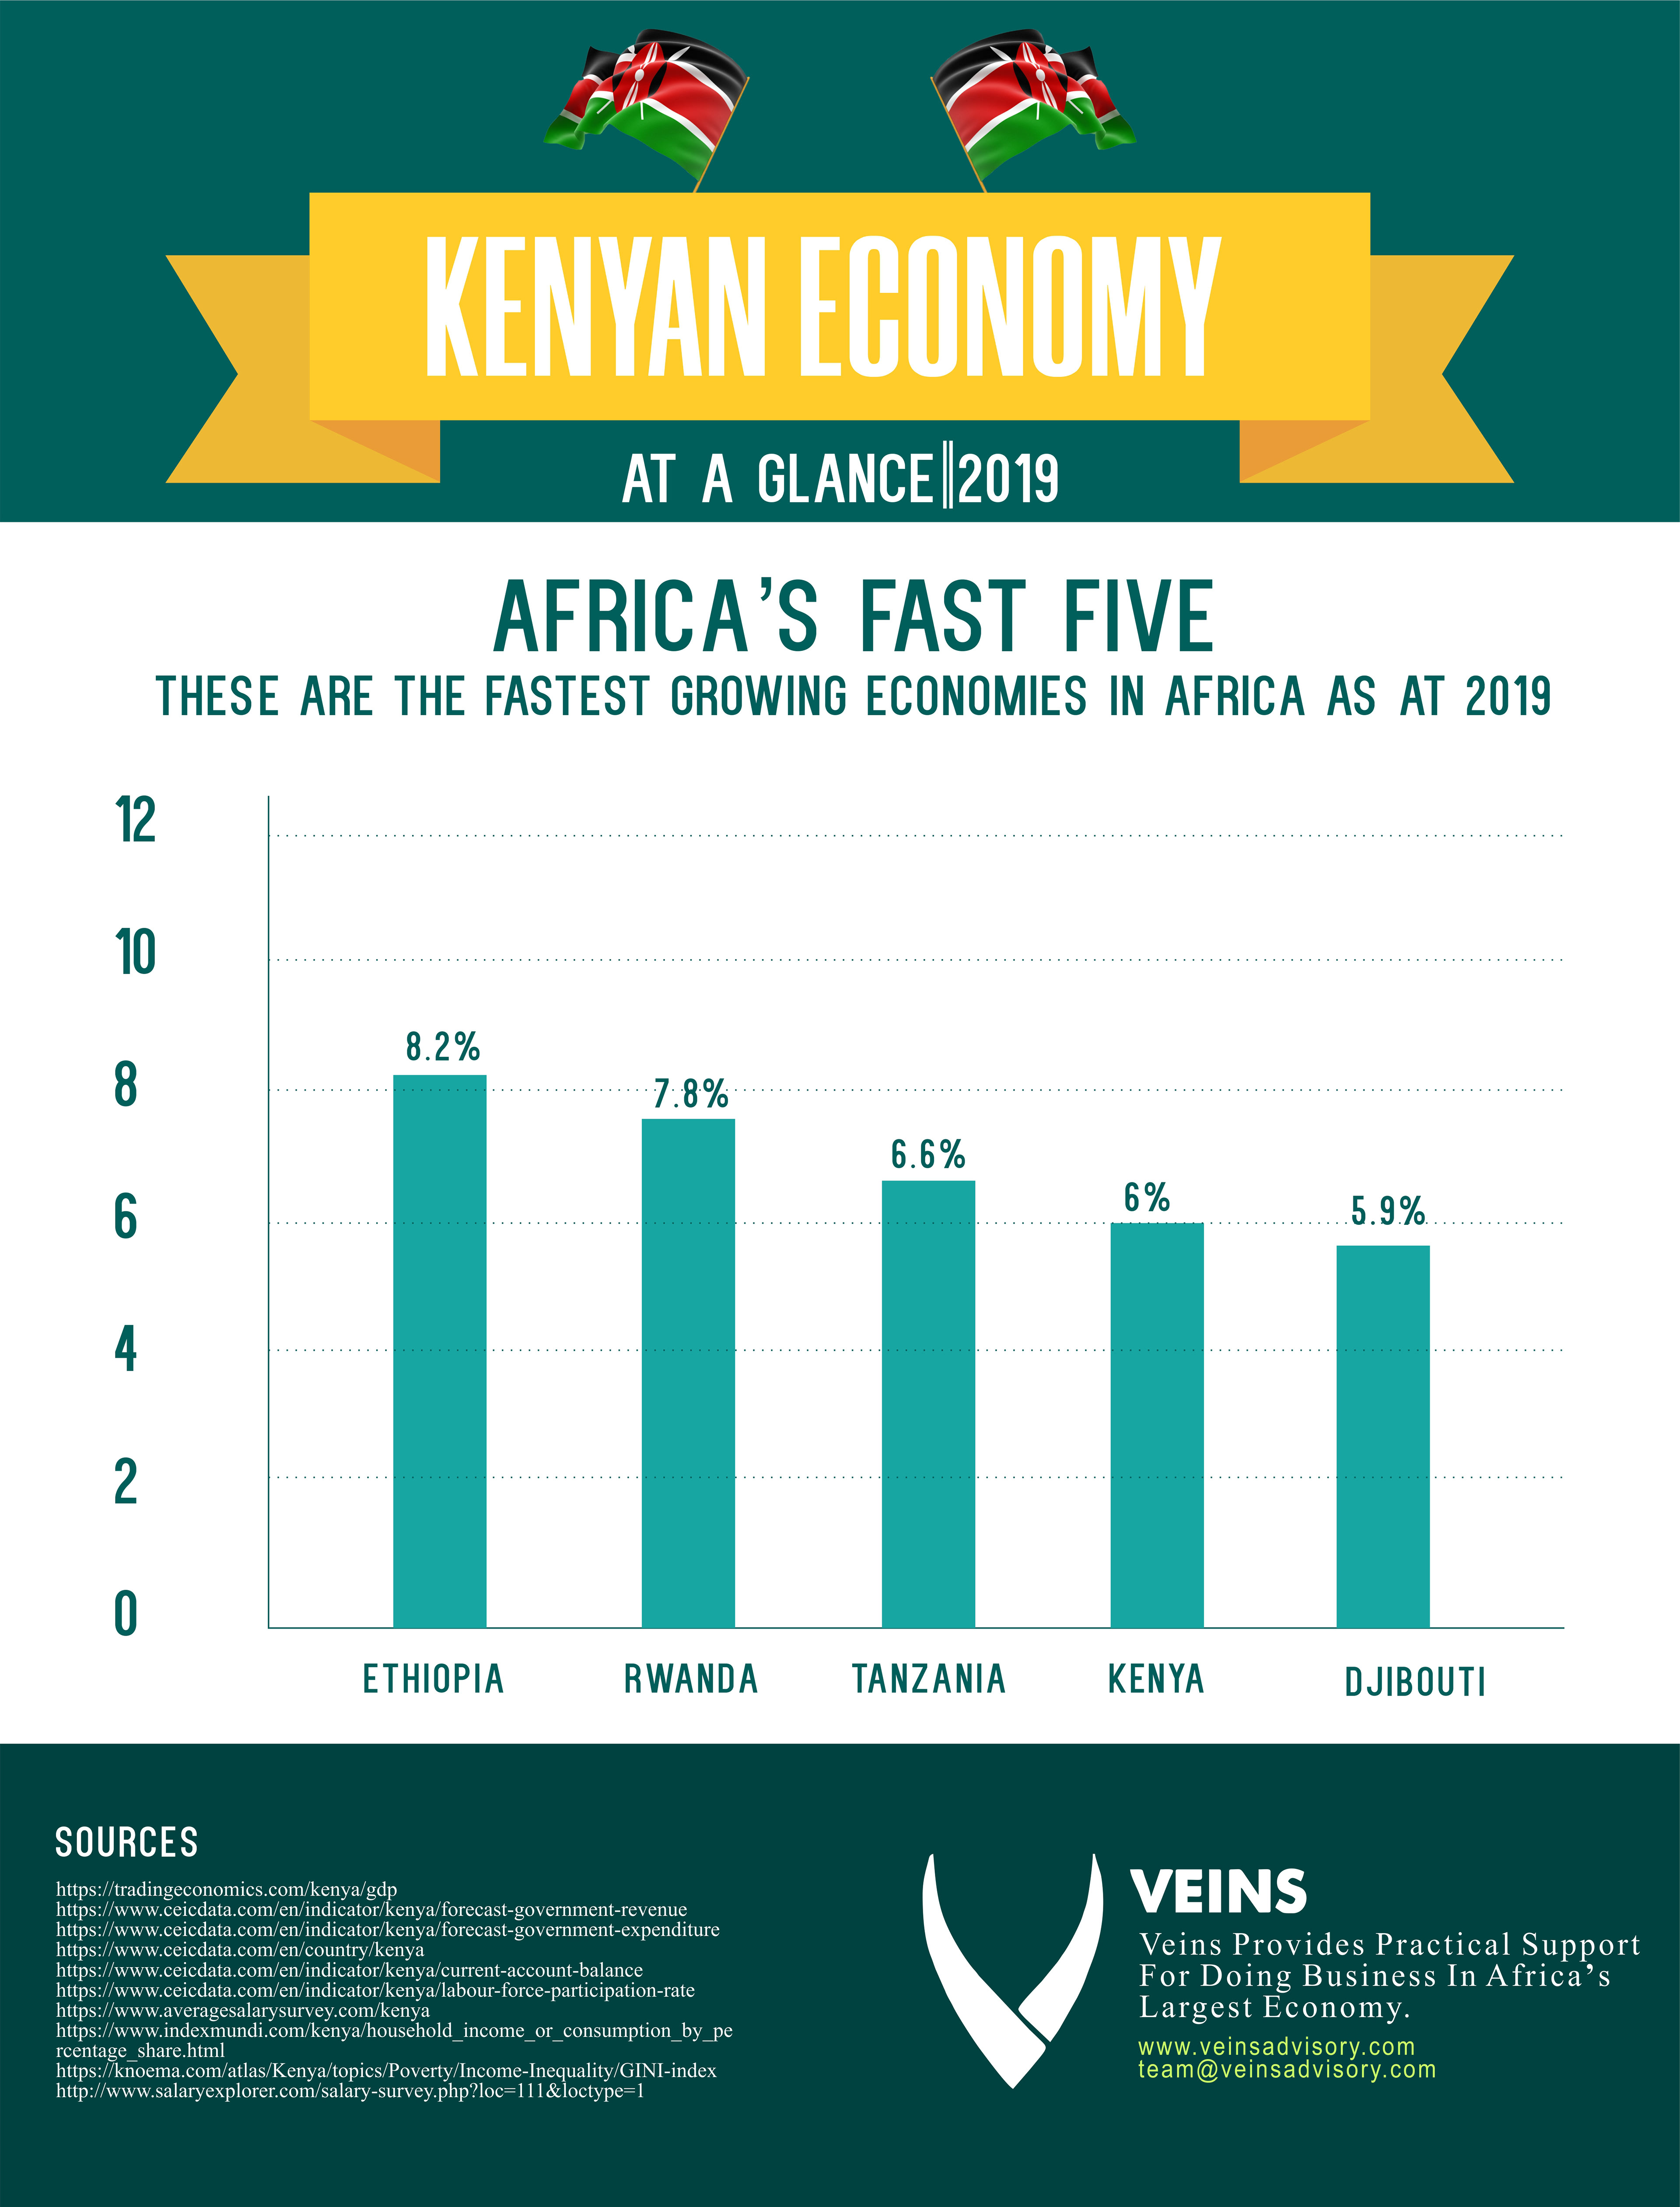
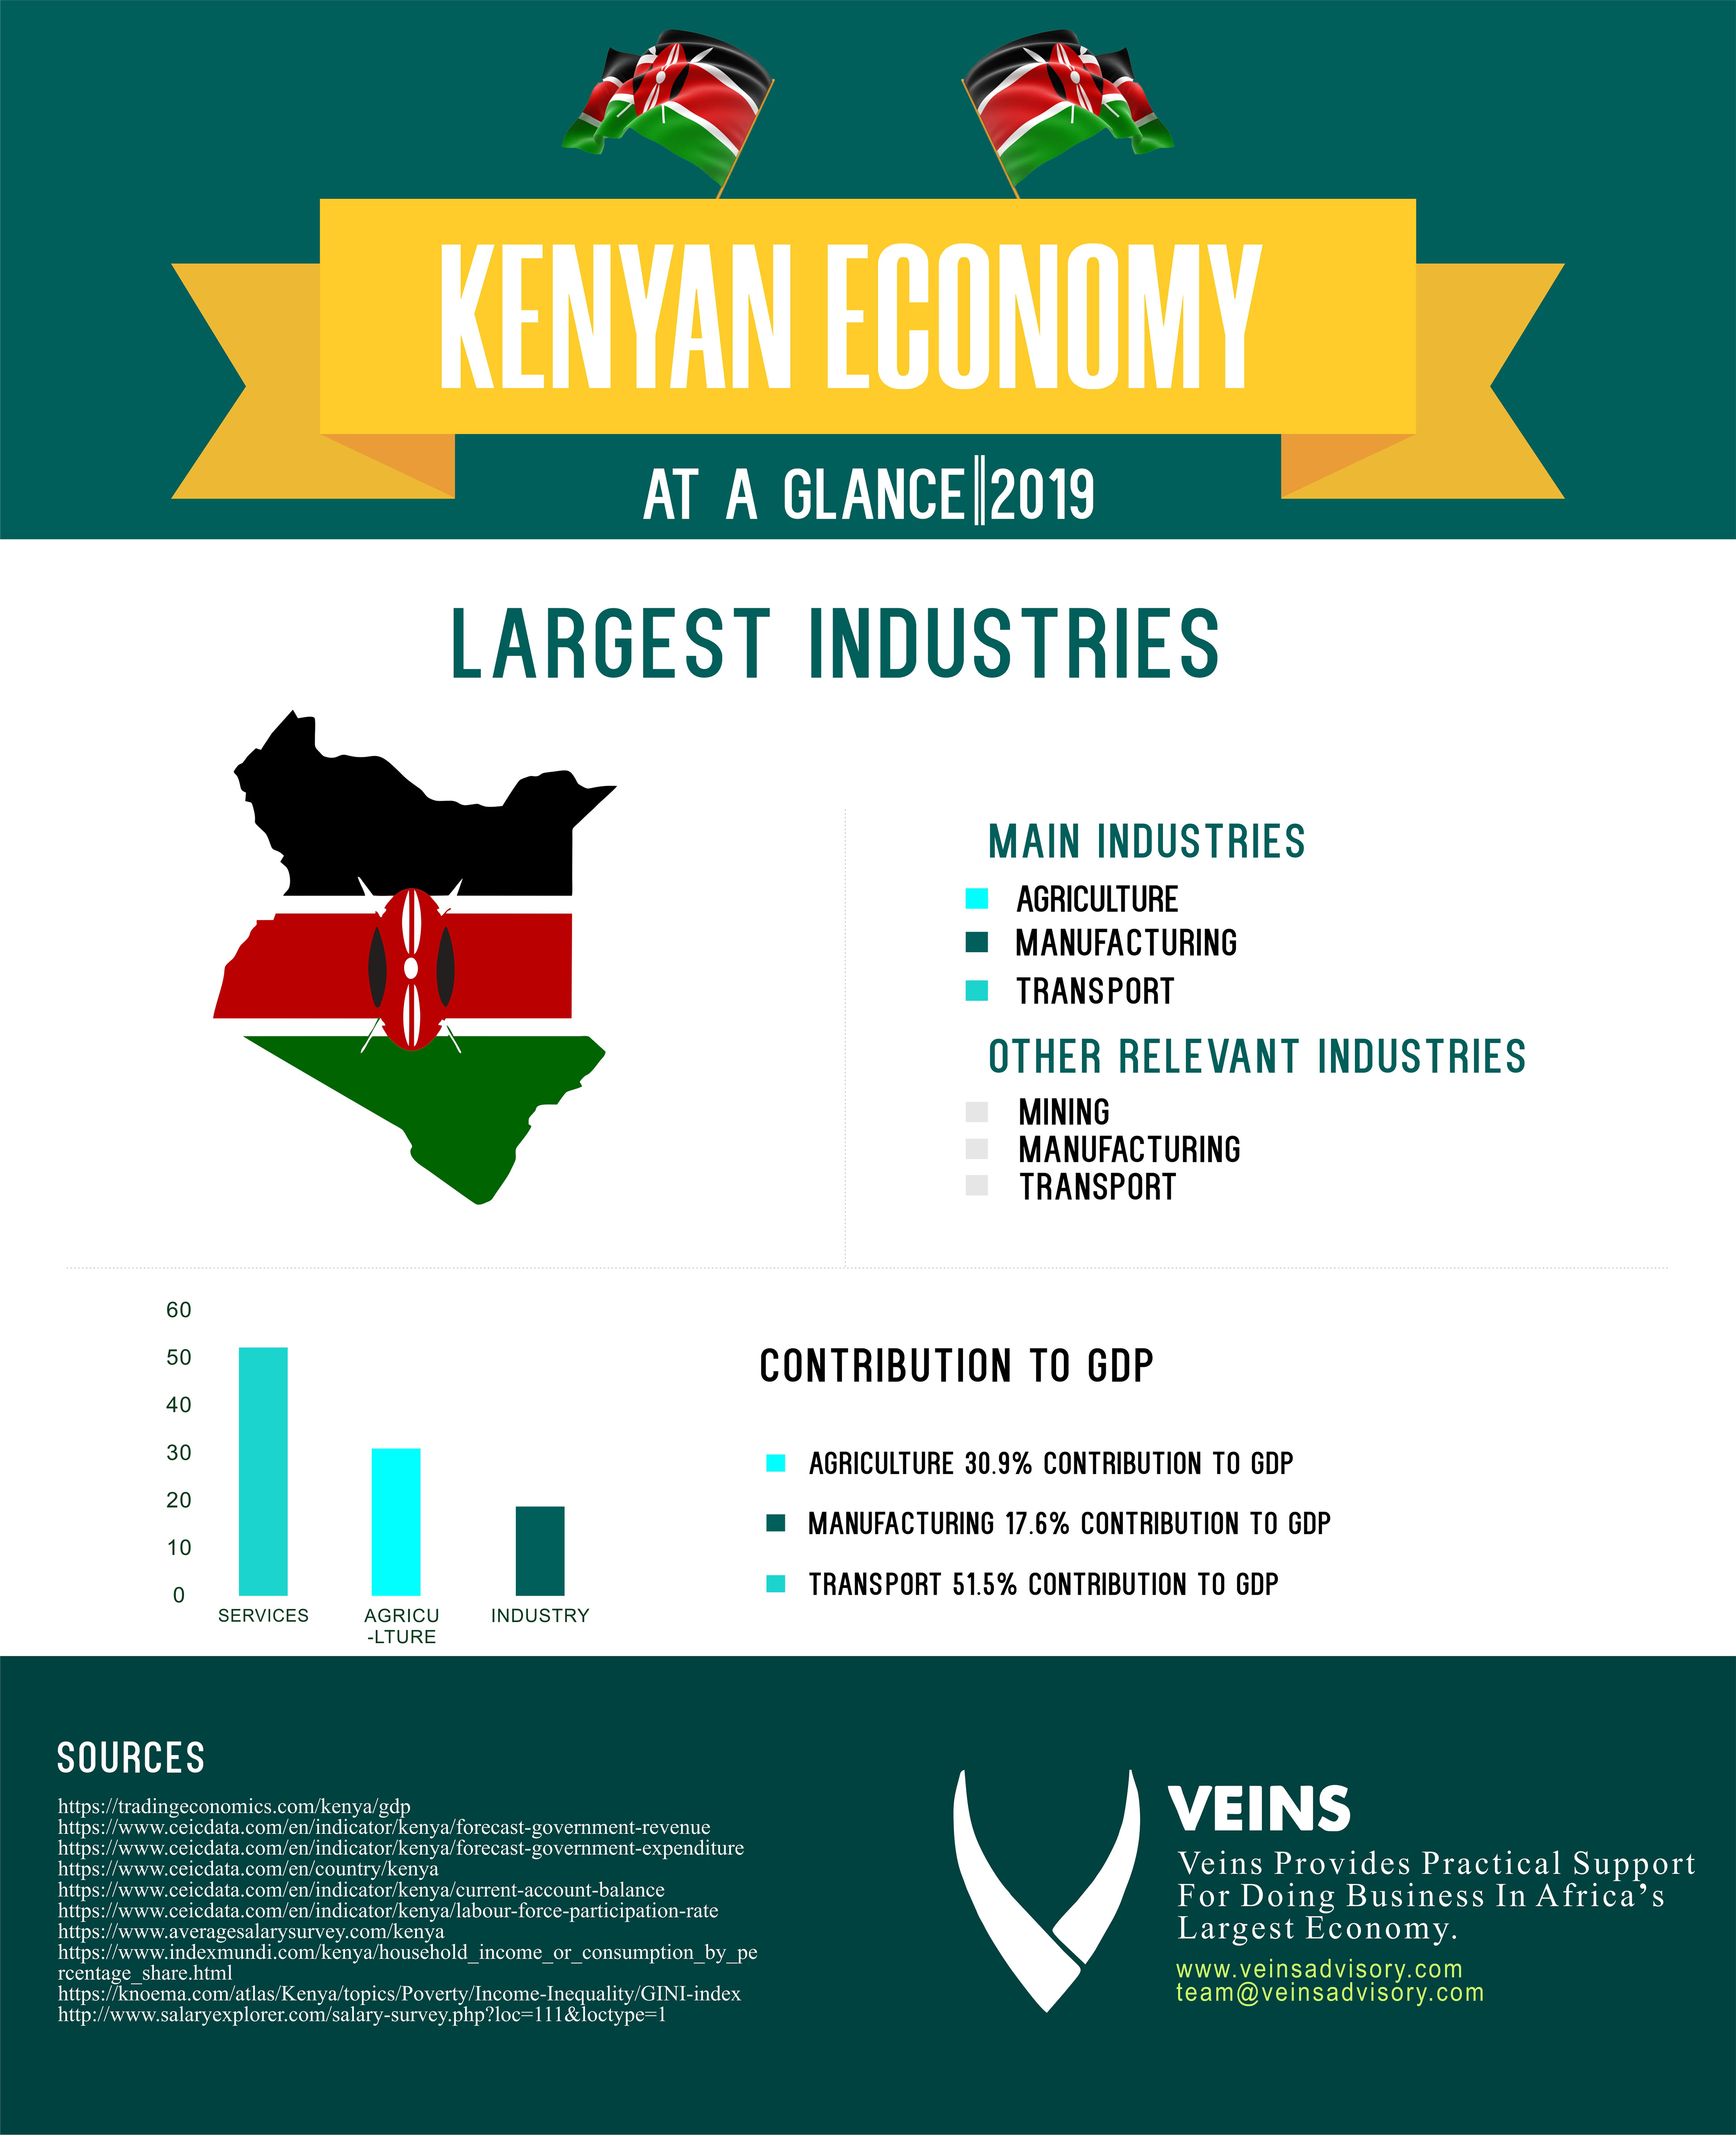
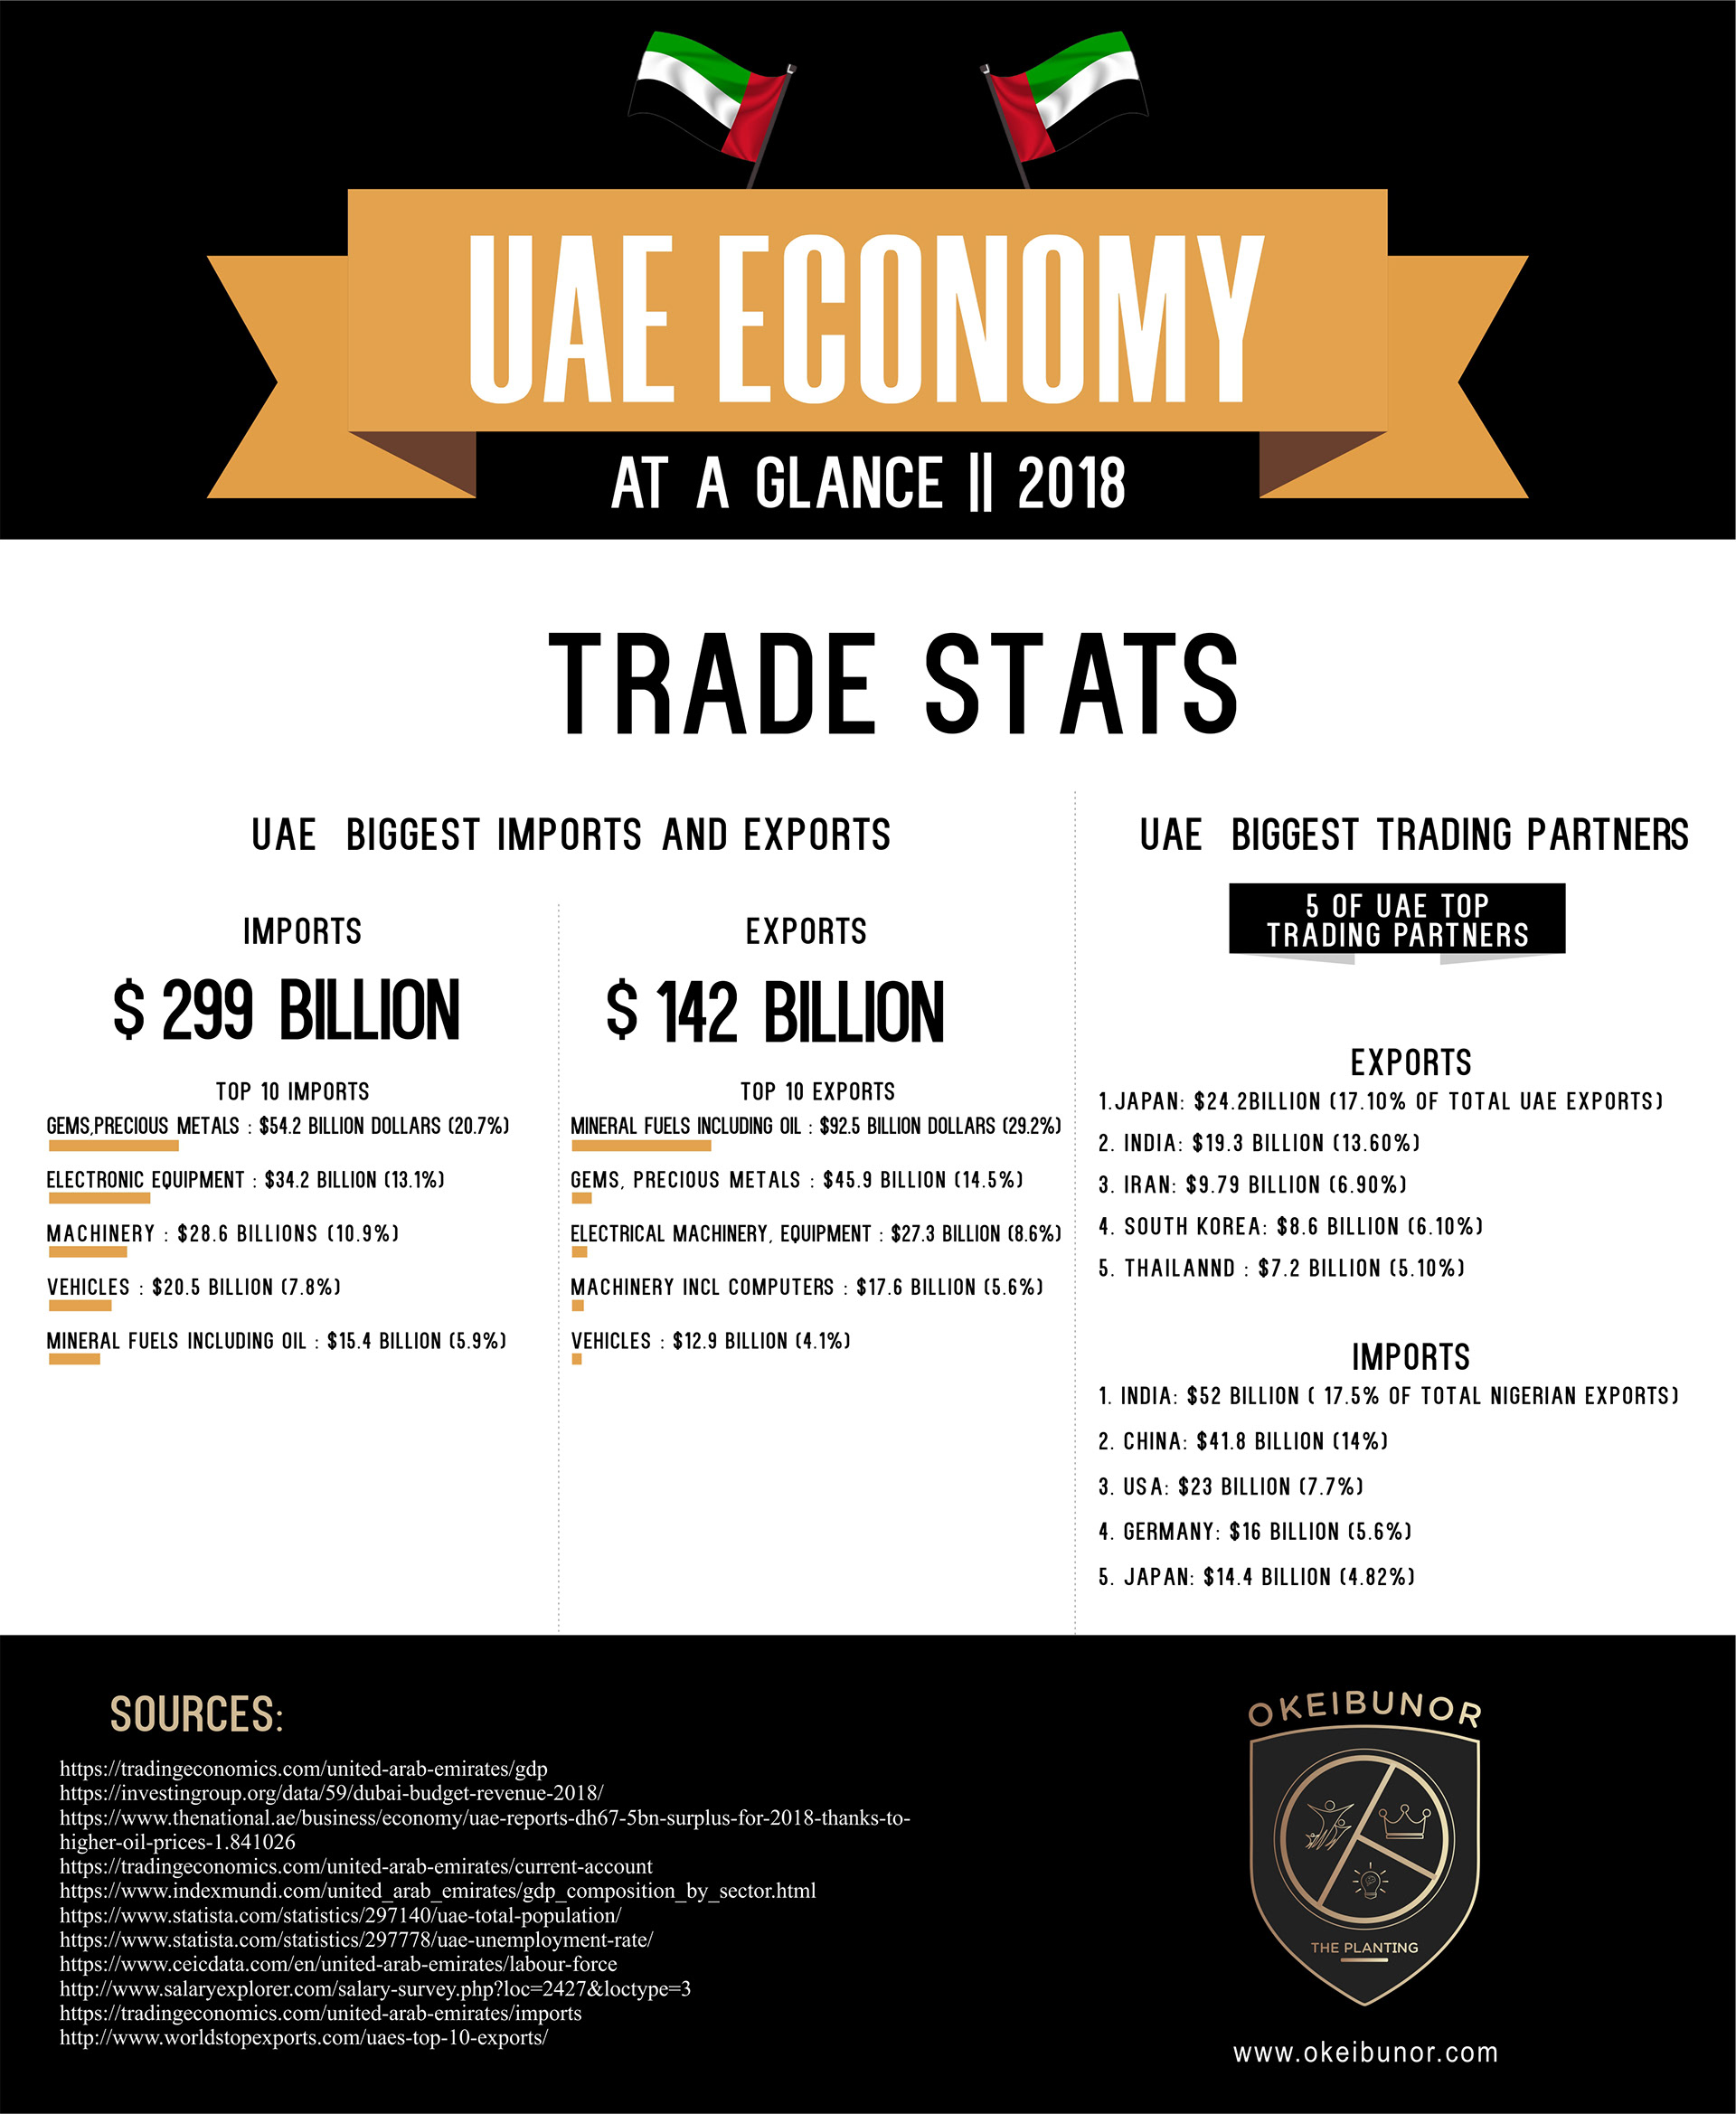
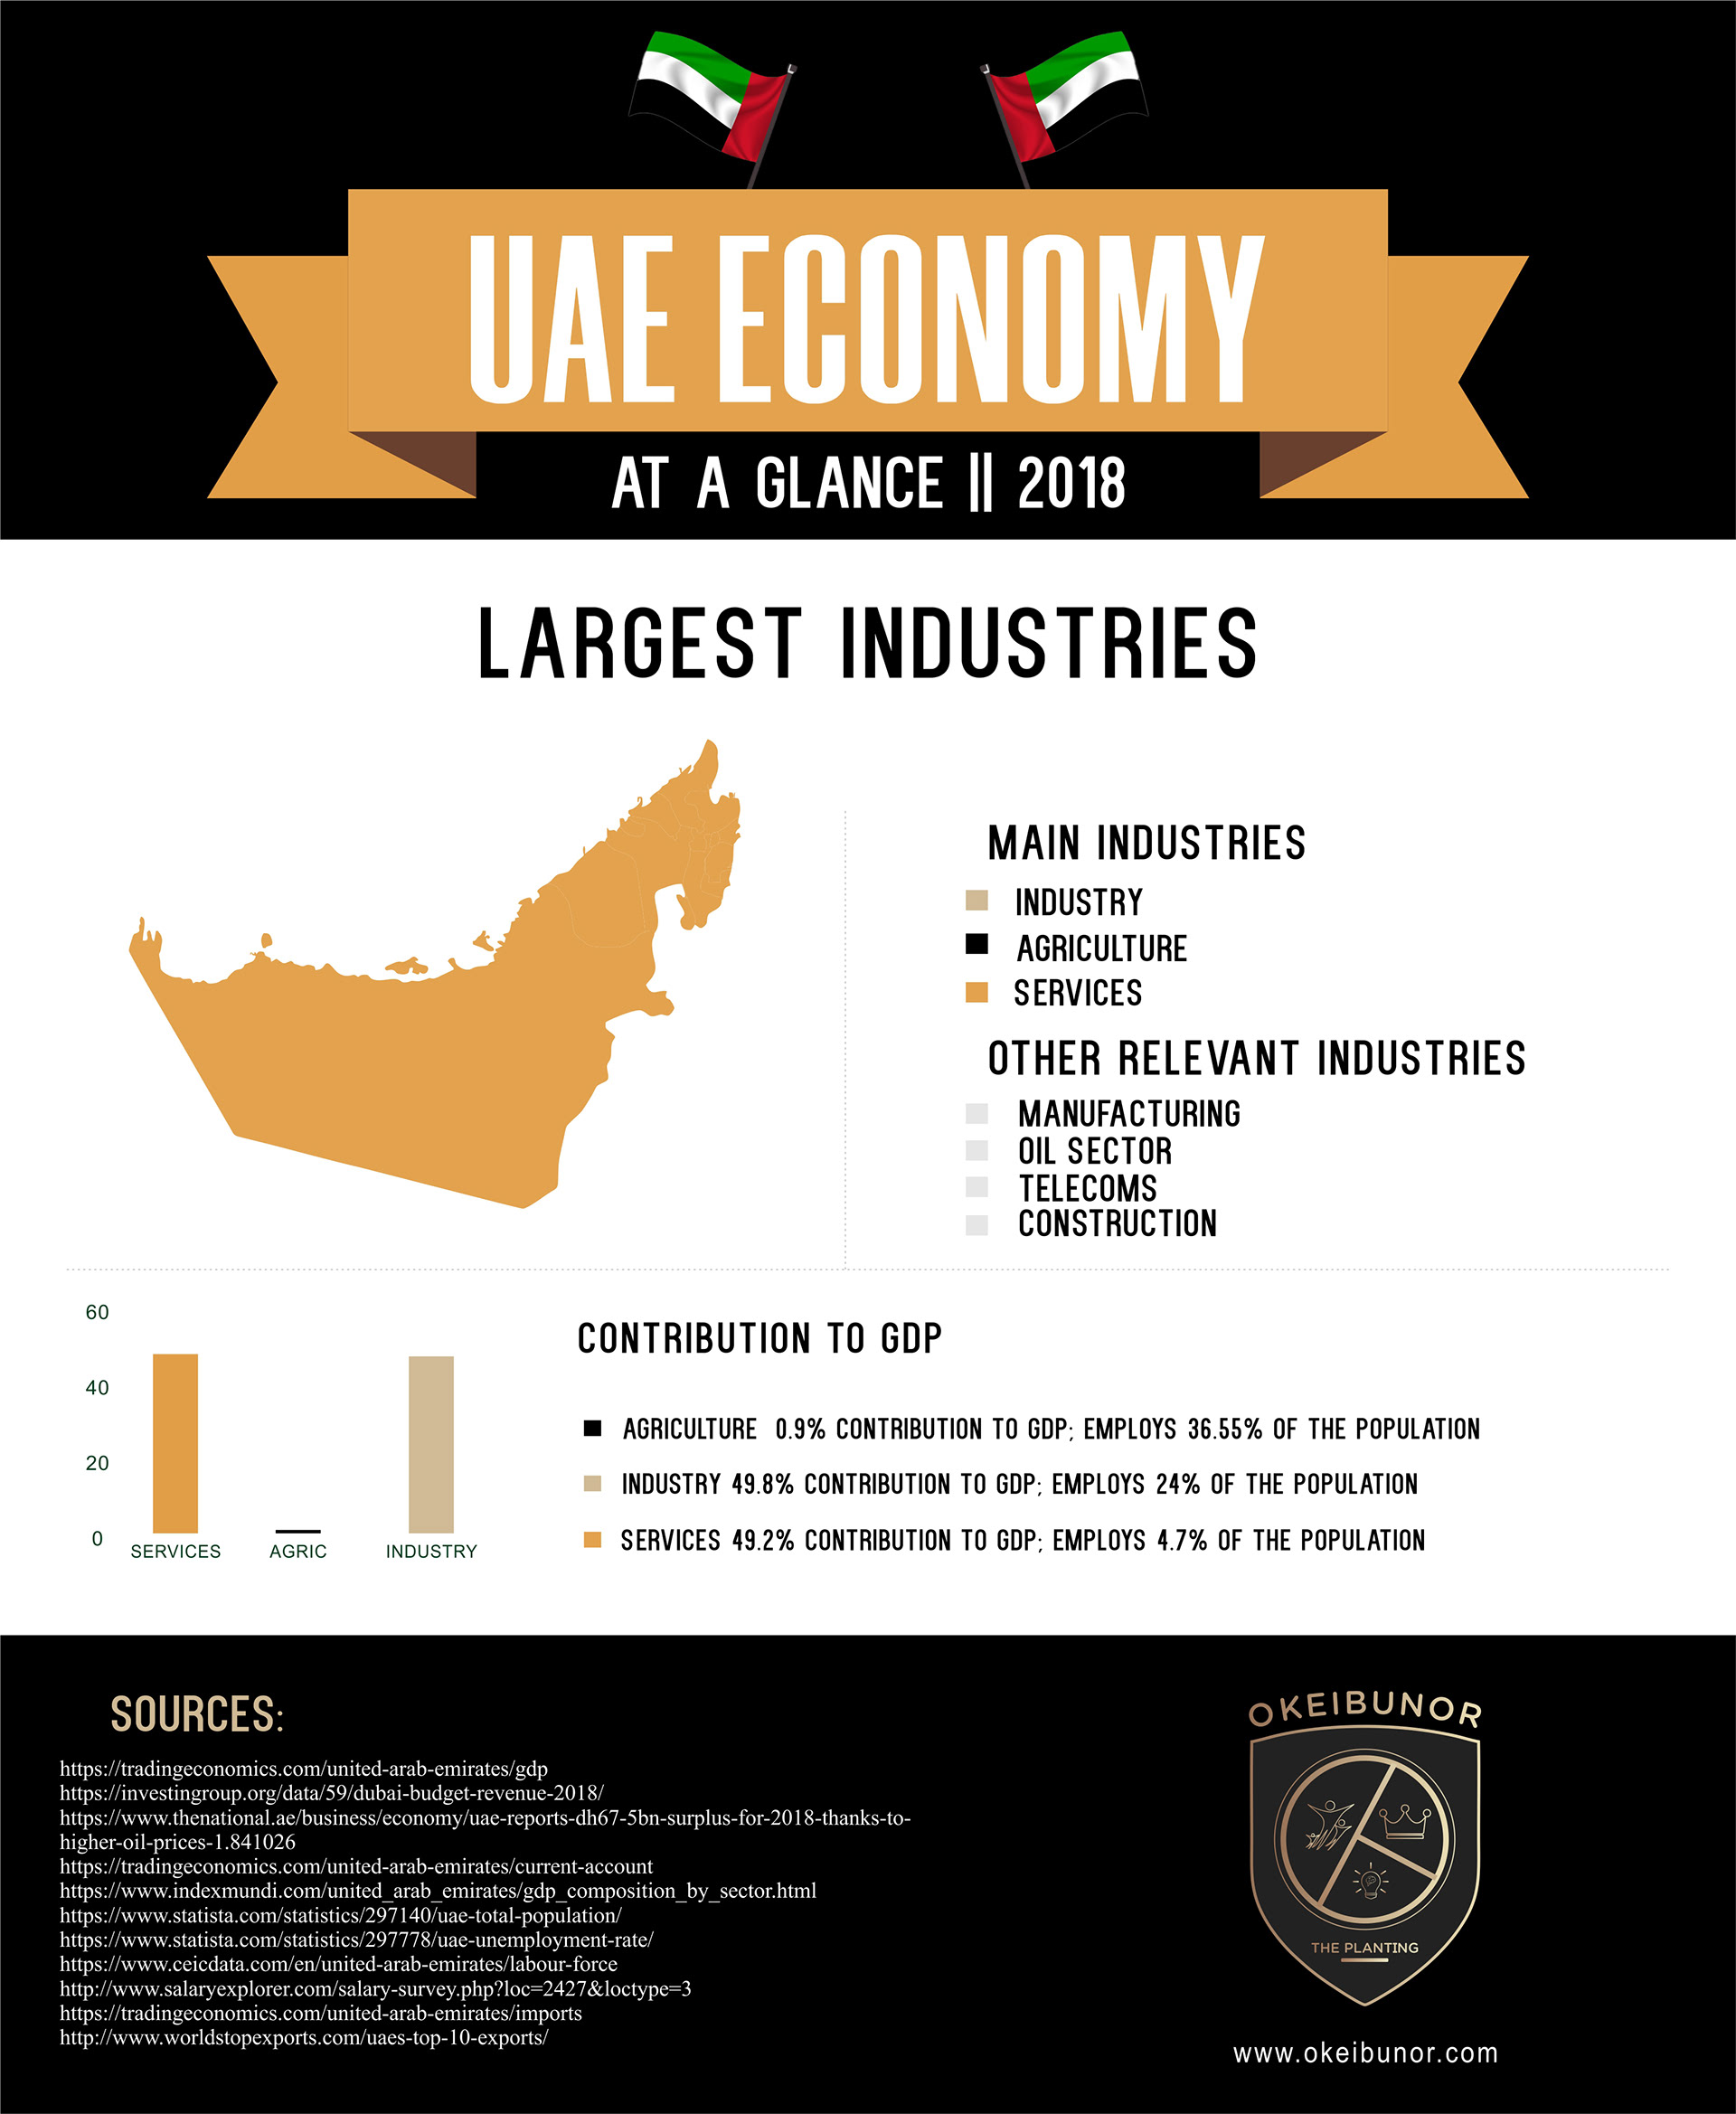
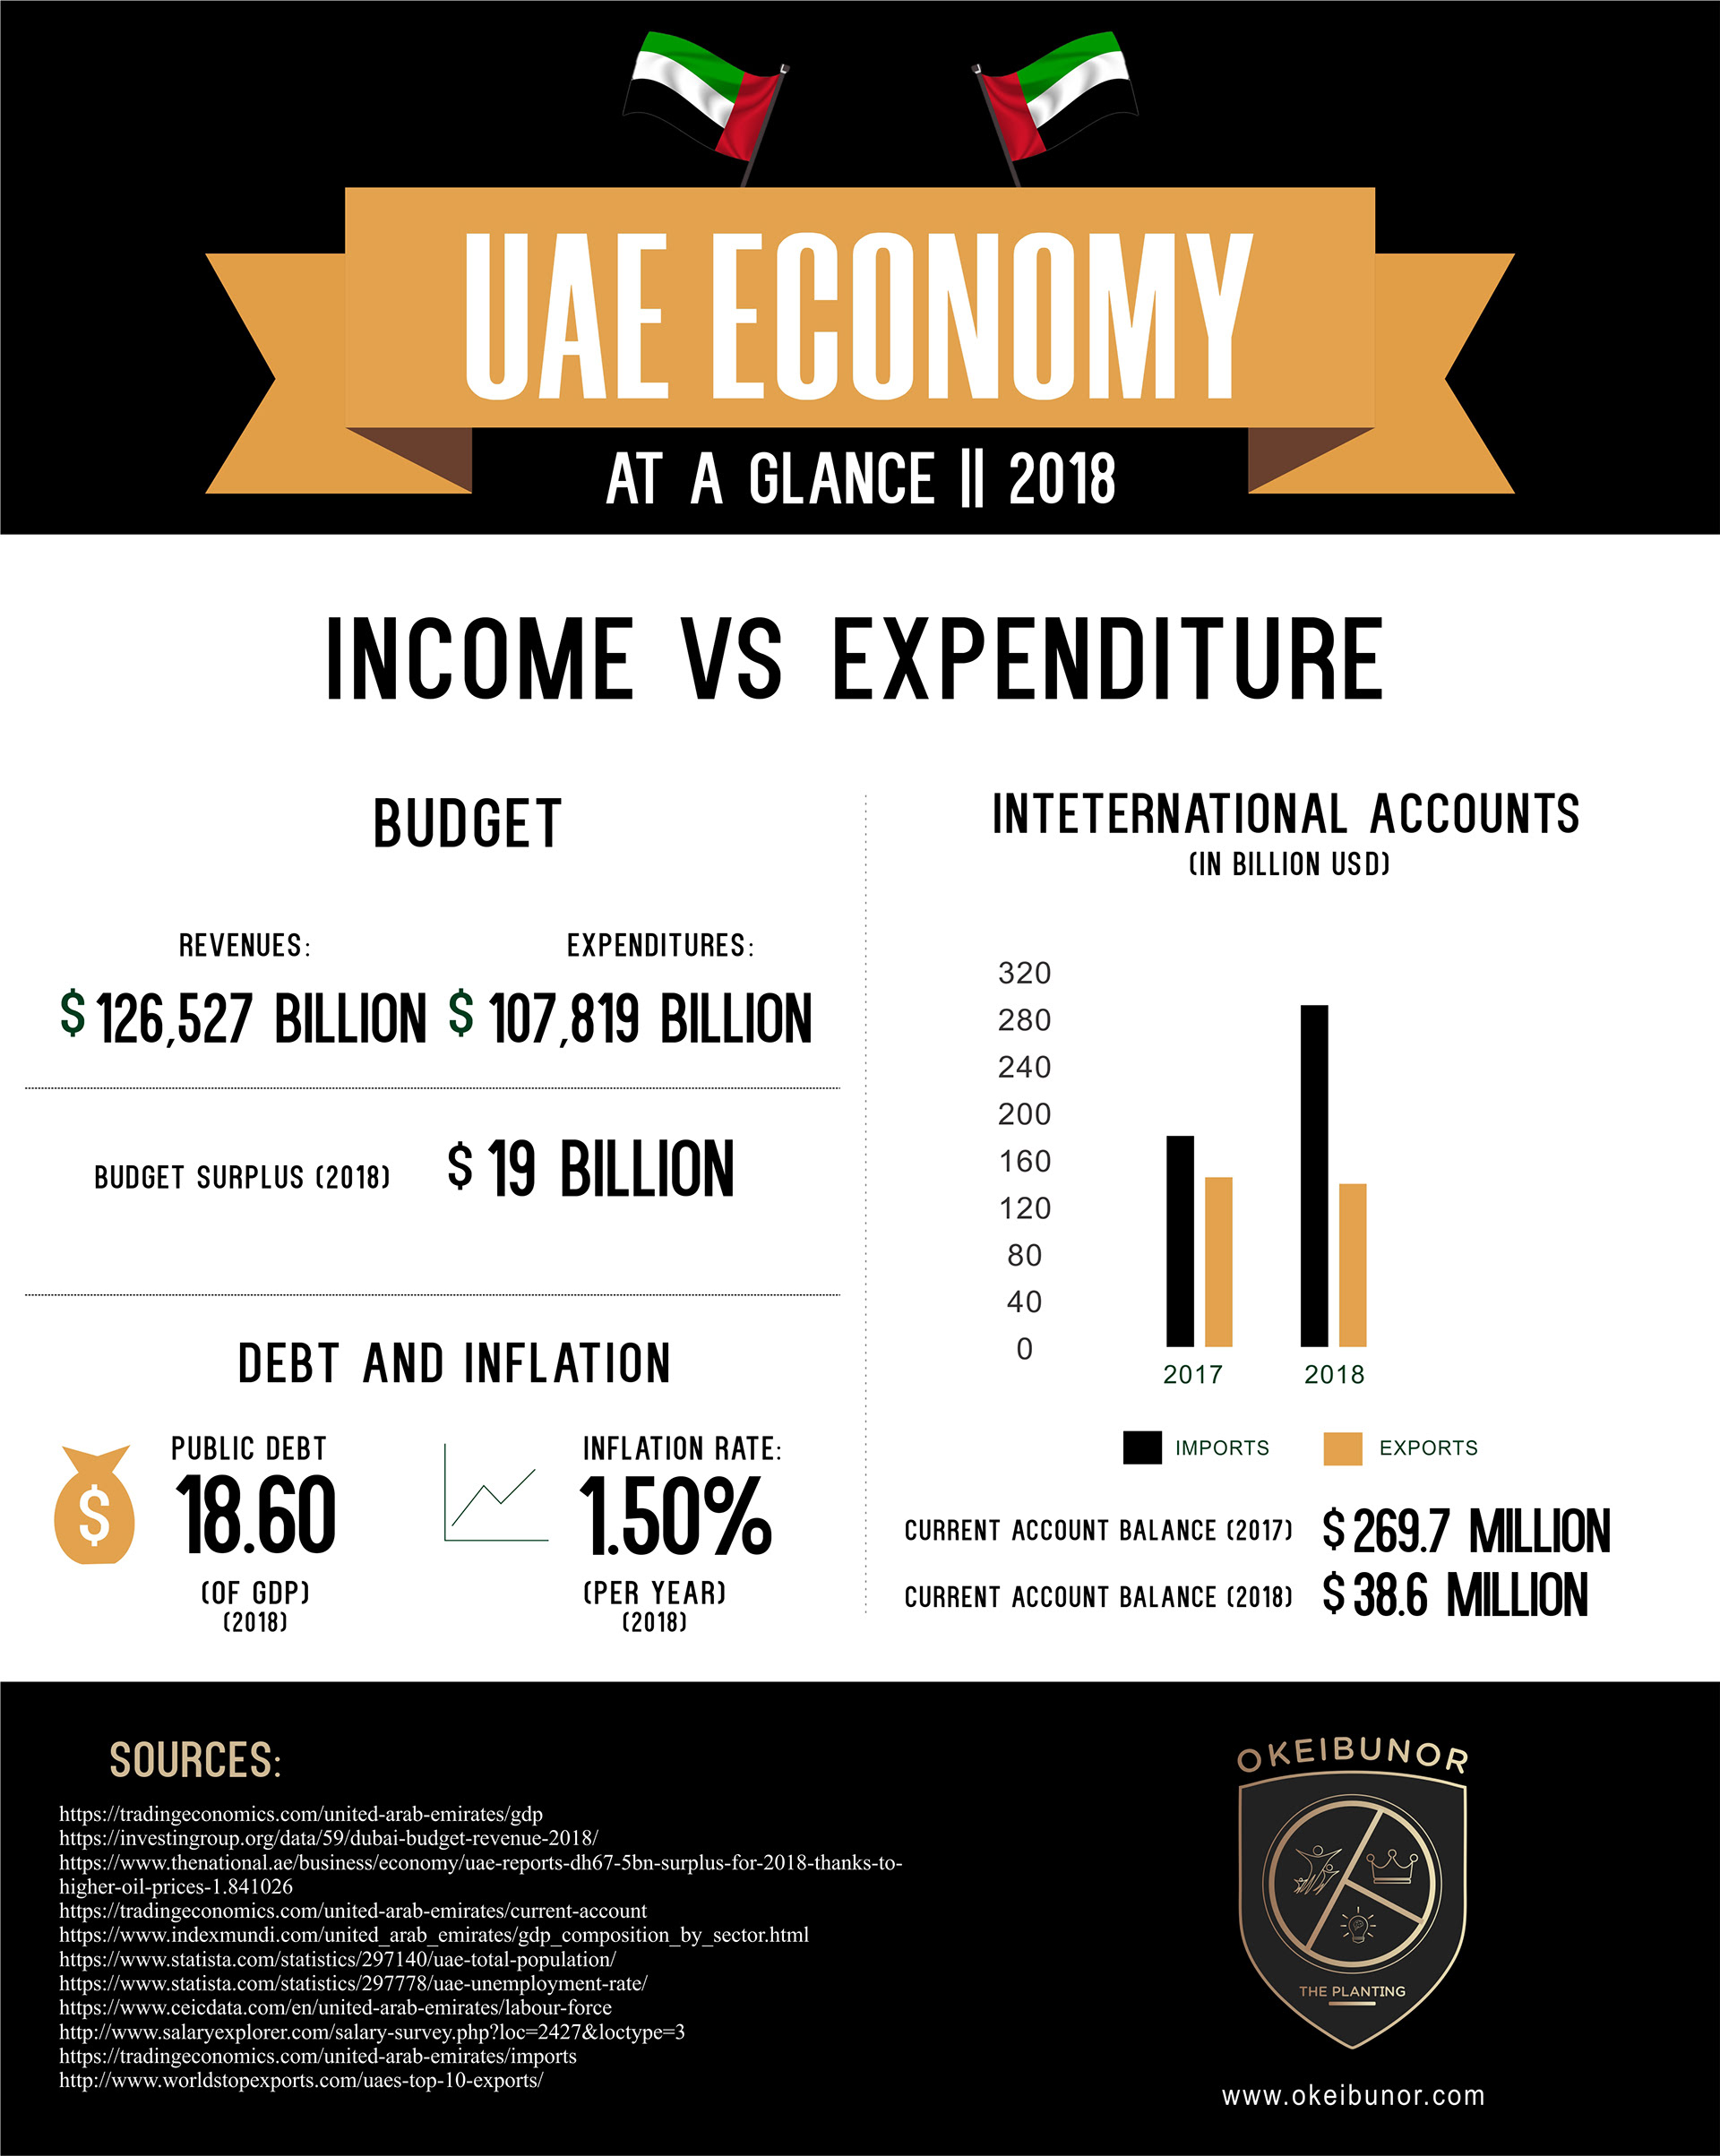
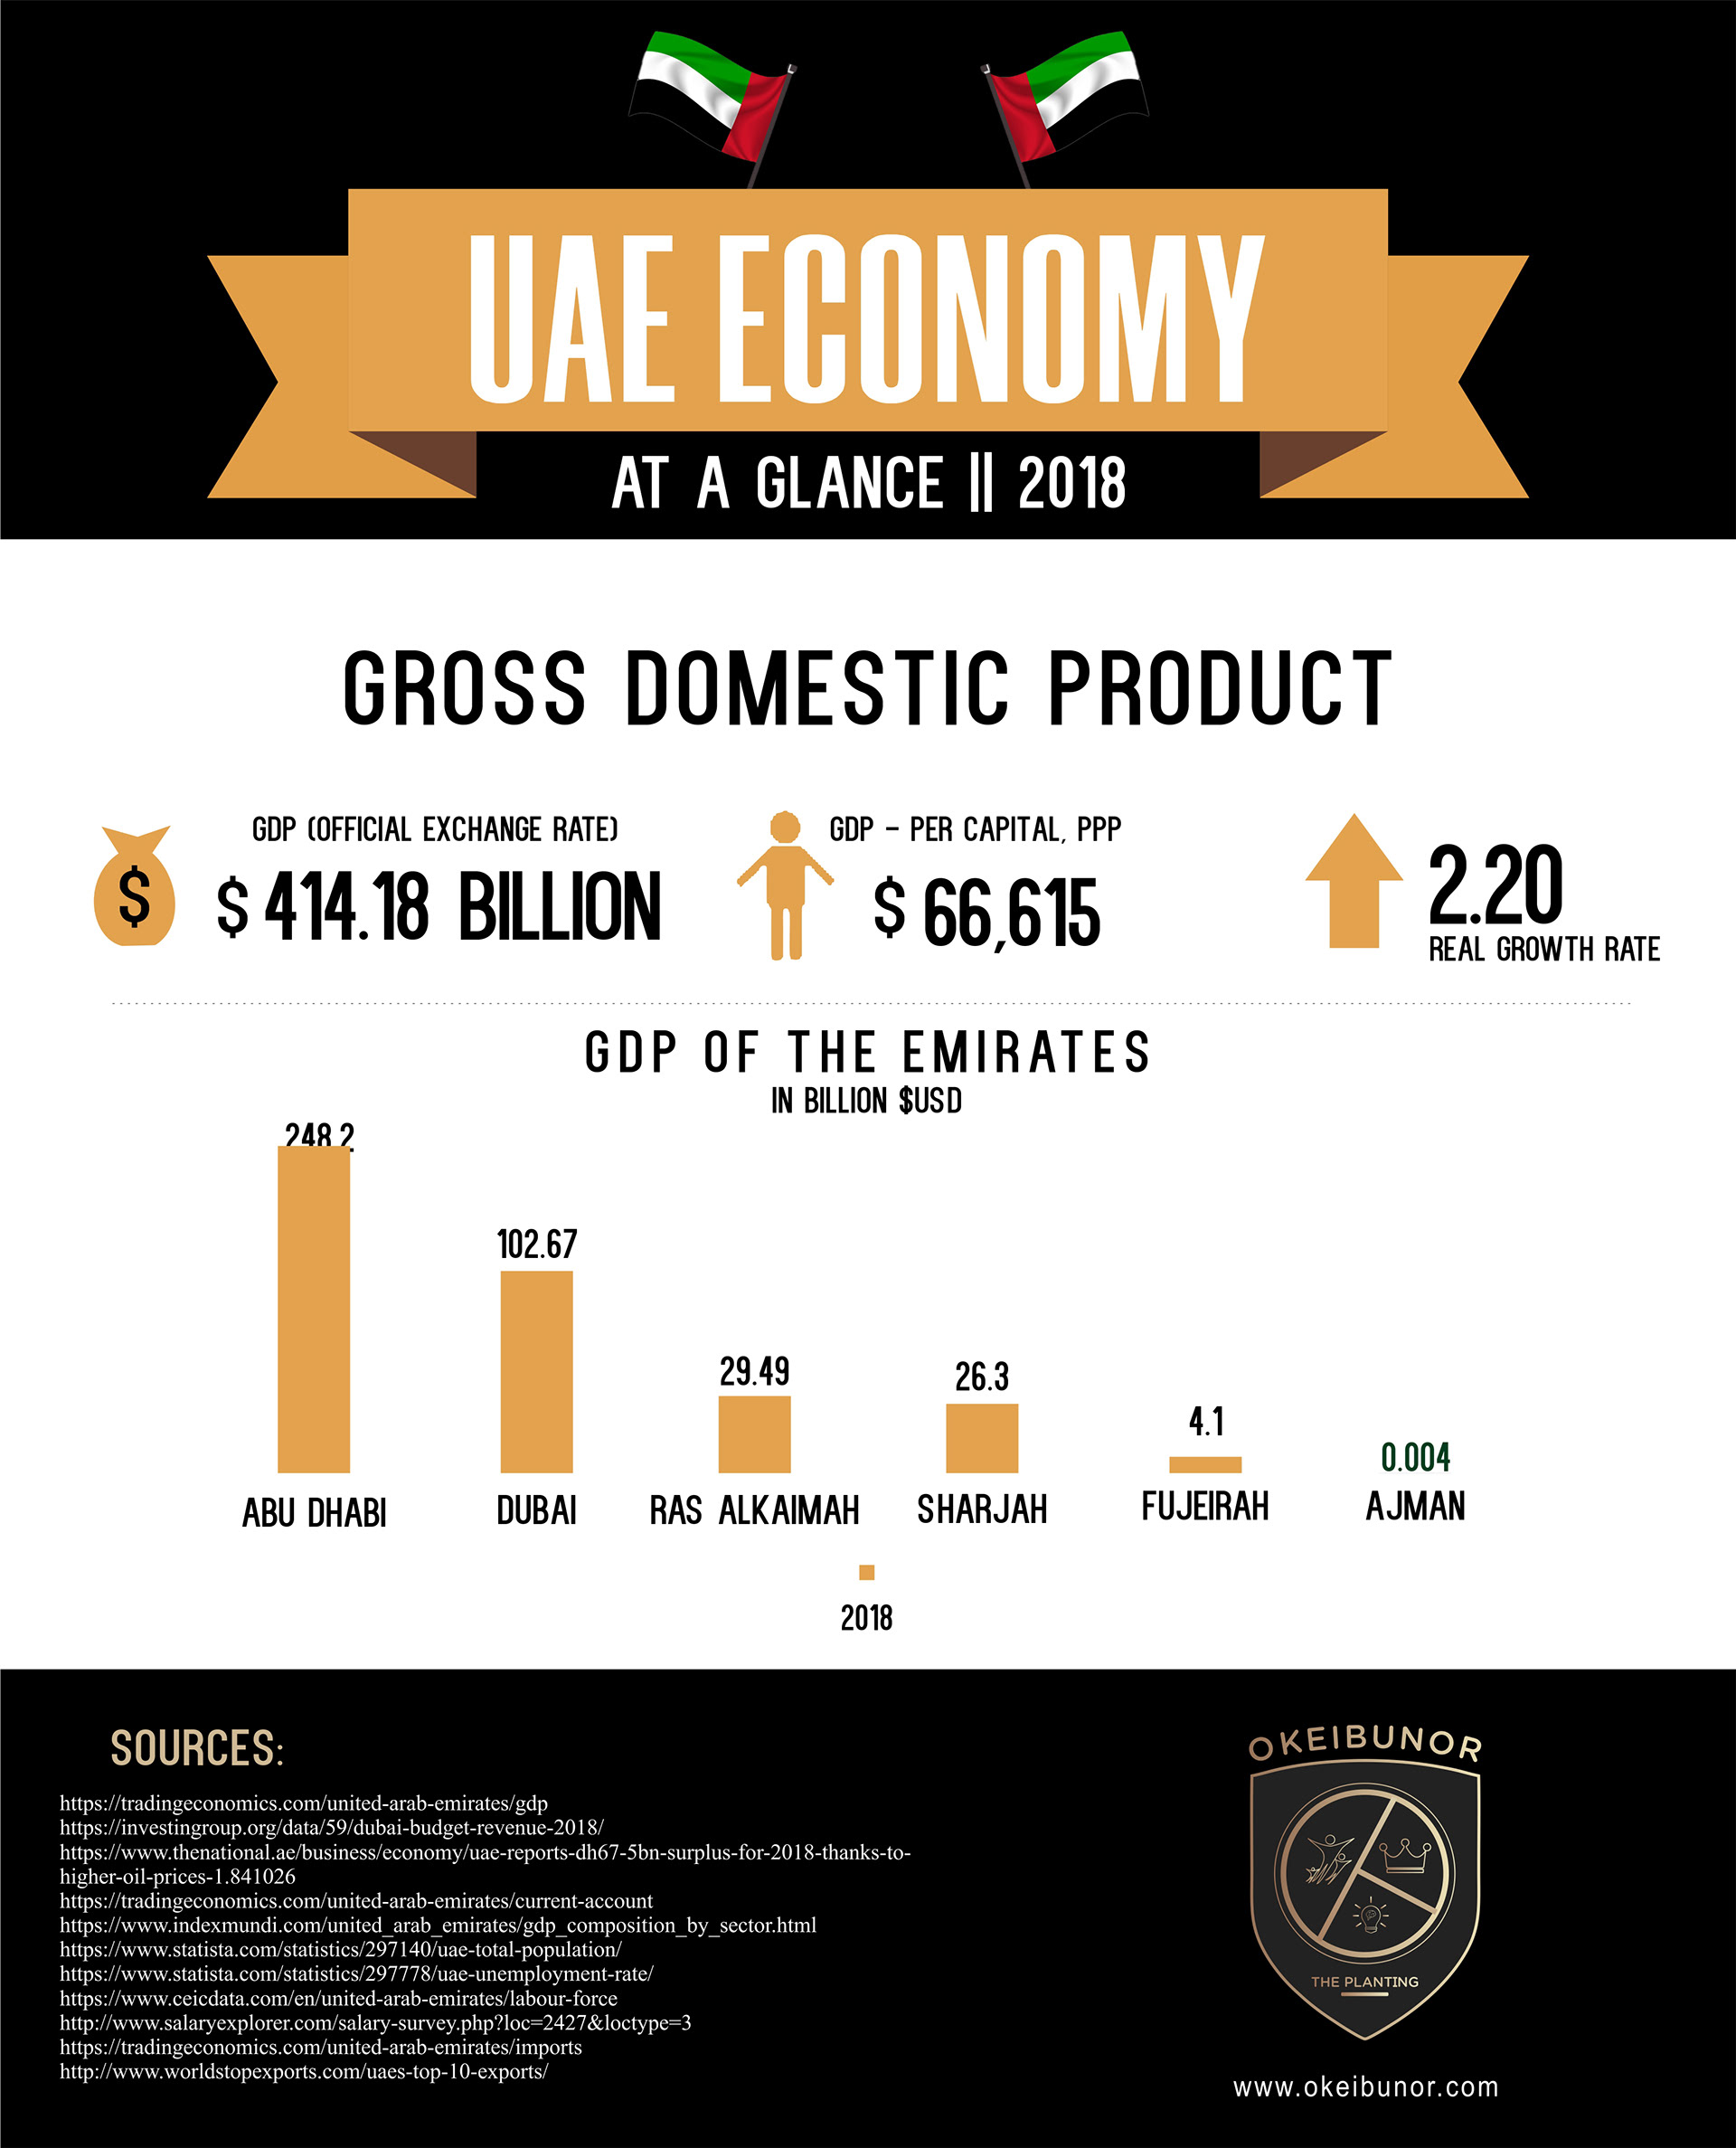
This project involved the design and development of a three-part infographic series summarizing the economic landscape of the United Arab Emirates (UAE) in 2018. The goal was to present complex statistical data—trade statistics, industrial contributions, and fiscal performance—in a visually engaging and easily digestible format for a general audience. This was a self-initiated project intended to showcase data storytelling and infographic design proficiency using Adobe Illustrator and Coreldraw.
Problem & Goal:
Problem:
Economic data is often dense, numerical, and difficult for the public to digest without interpretation or design.
Goal:
To design an informative, branded infographic set that effectively simplifies and communicates key economic insights about the UAE, improving accessibility and engagement across digital platforms.
Research & Inspiration:
Data sources included: Statista, Trading Economics, IMF, and UAE government budget reports.
Researched government design templates and other economic dashboards to identify best practices in data hierarchy and labeling.
Developed a color palette inspired by the UAE national colors and a clean black/gold contrast to highlight figures and charts.
Color Palette: Black, Gold, White, Red, Green
Fonts Used: Bebas Neue (headlines), Montserrat (body)
Design Style: Flat design with icon accents and infographic charts
Fonts Used: Bebas Neue (headlines), Montserrat (body)
Design Style: Flat design with icon accents and infographic charts
Impact:
This project demonstrated how effective visual communication can make economic data approachable for a wide audience. It stands as a portfolio piece that highlights technical layout skills, design consistency, and an understanding of content-driven communication.
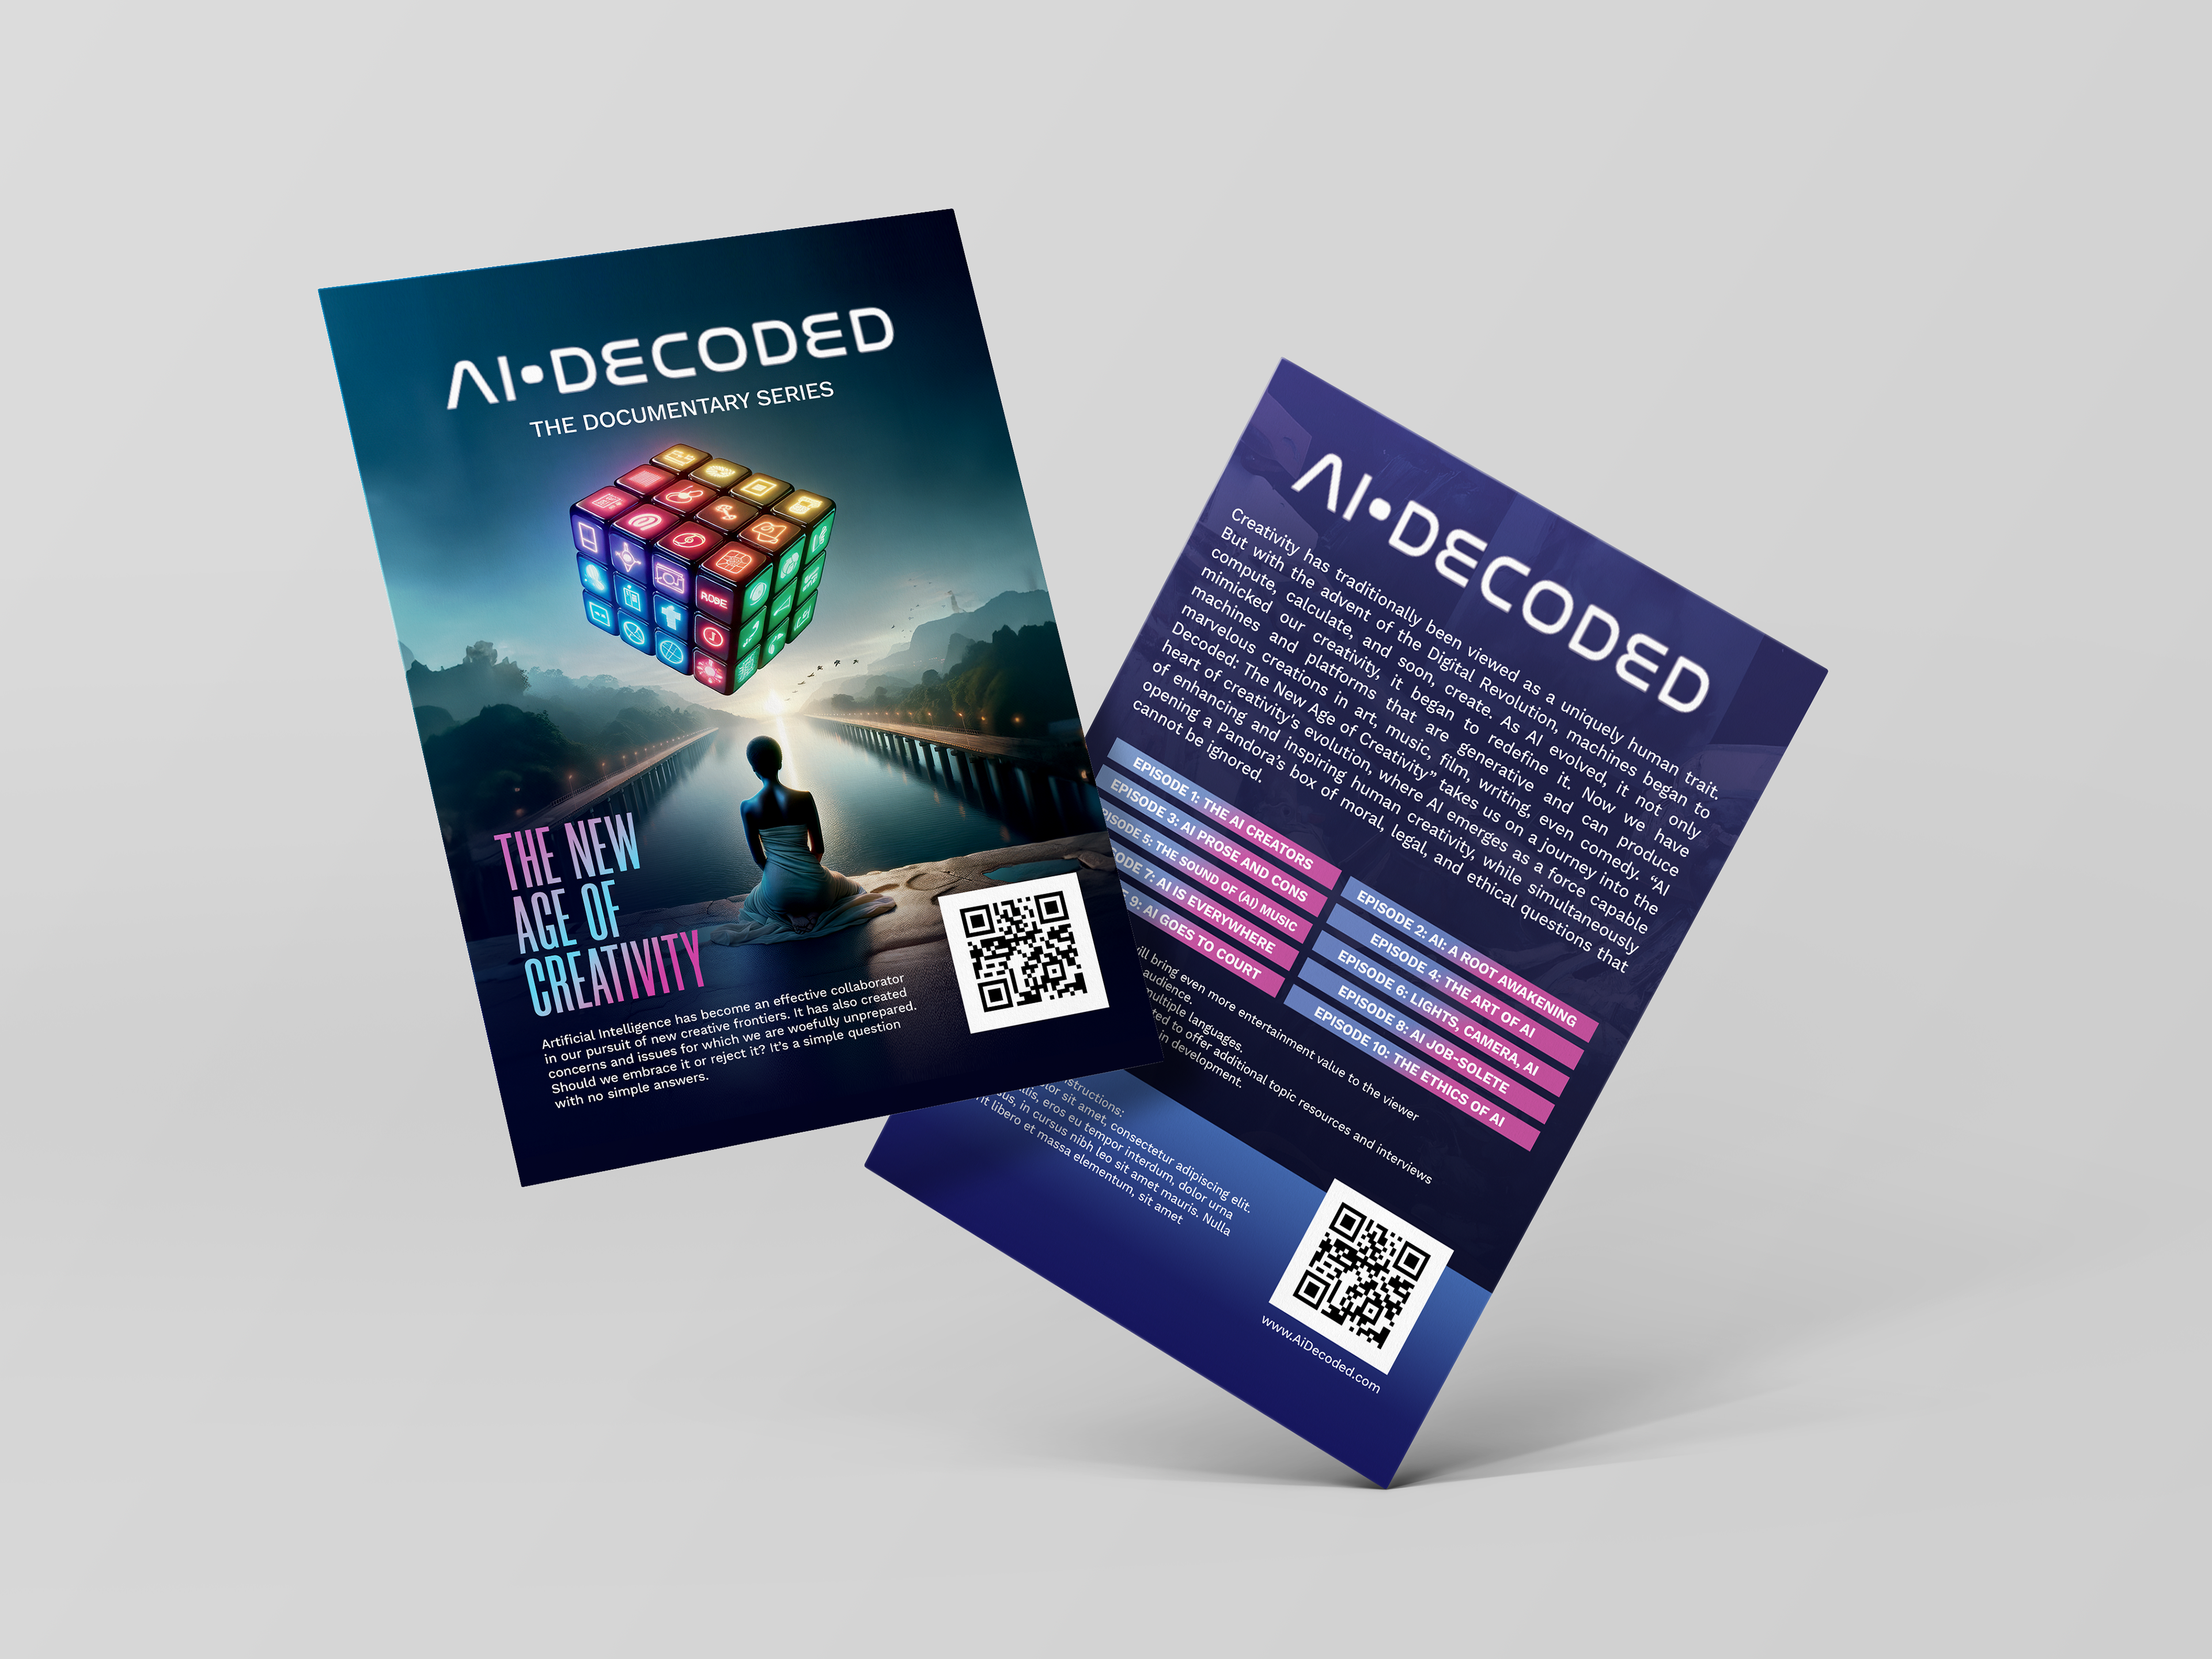
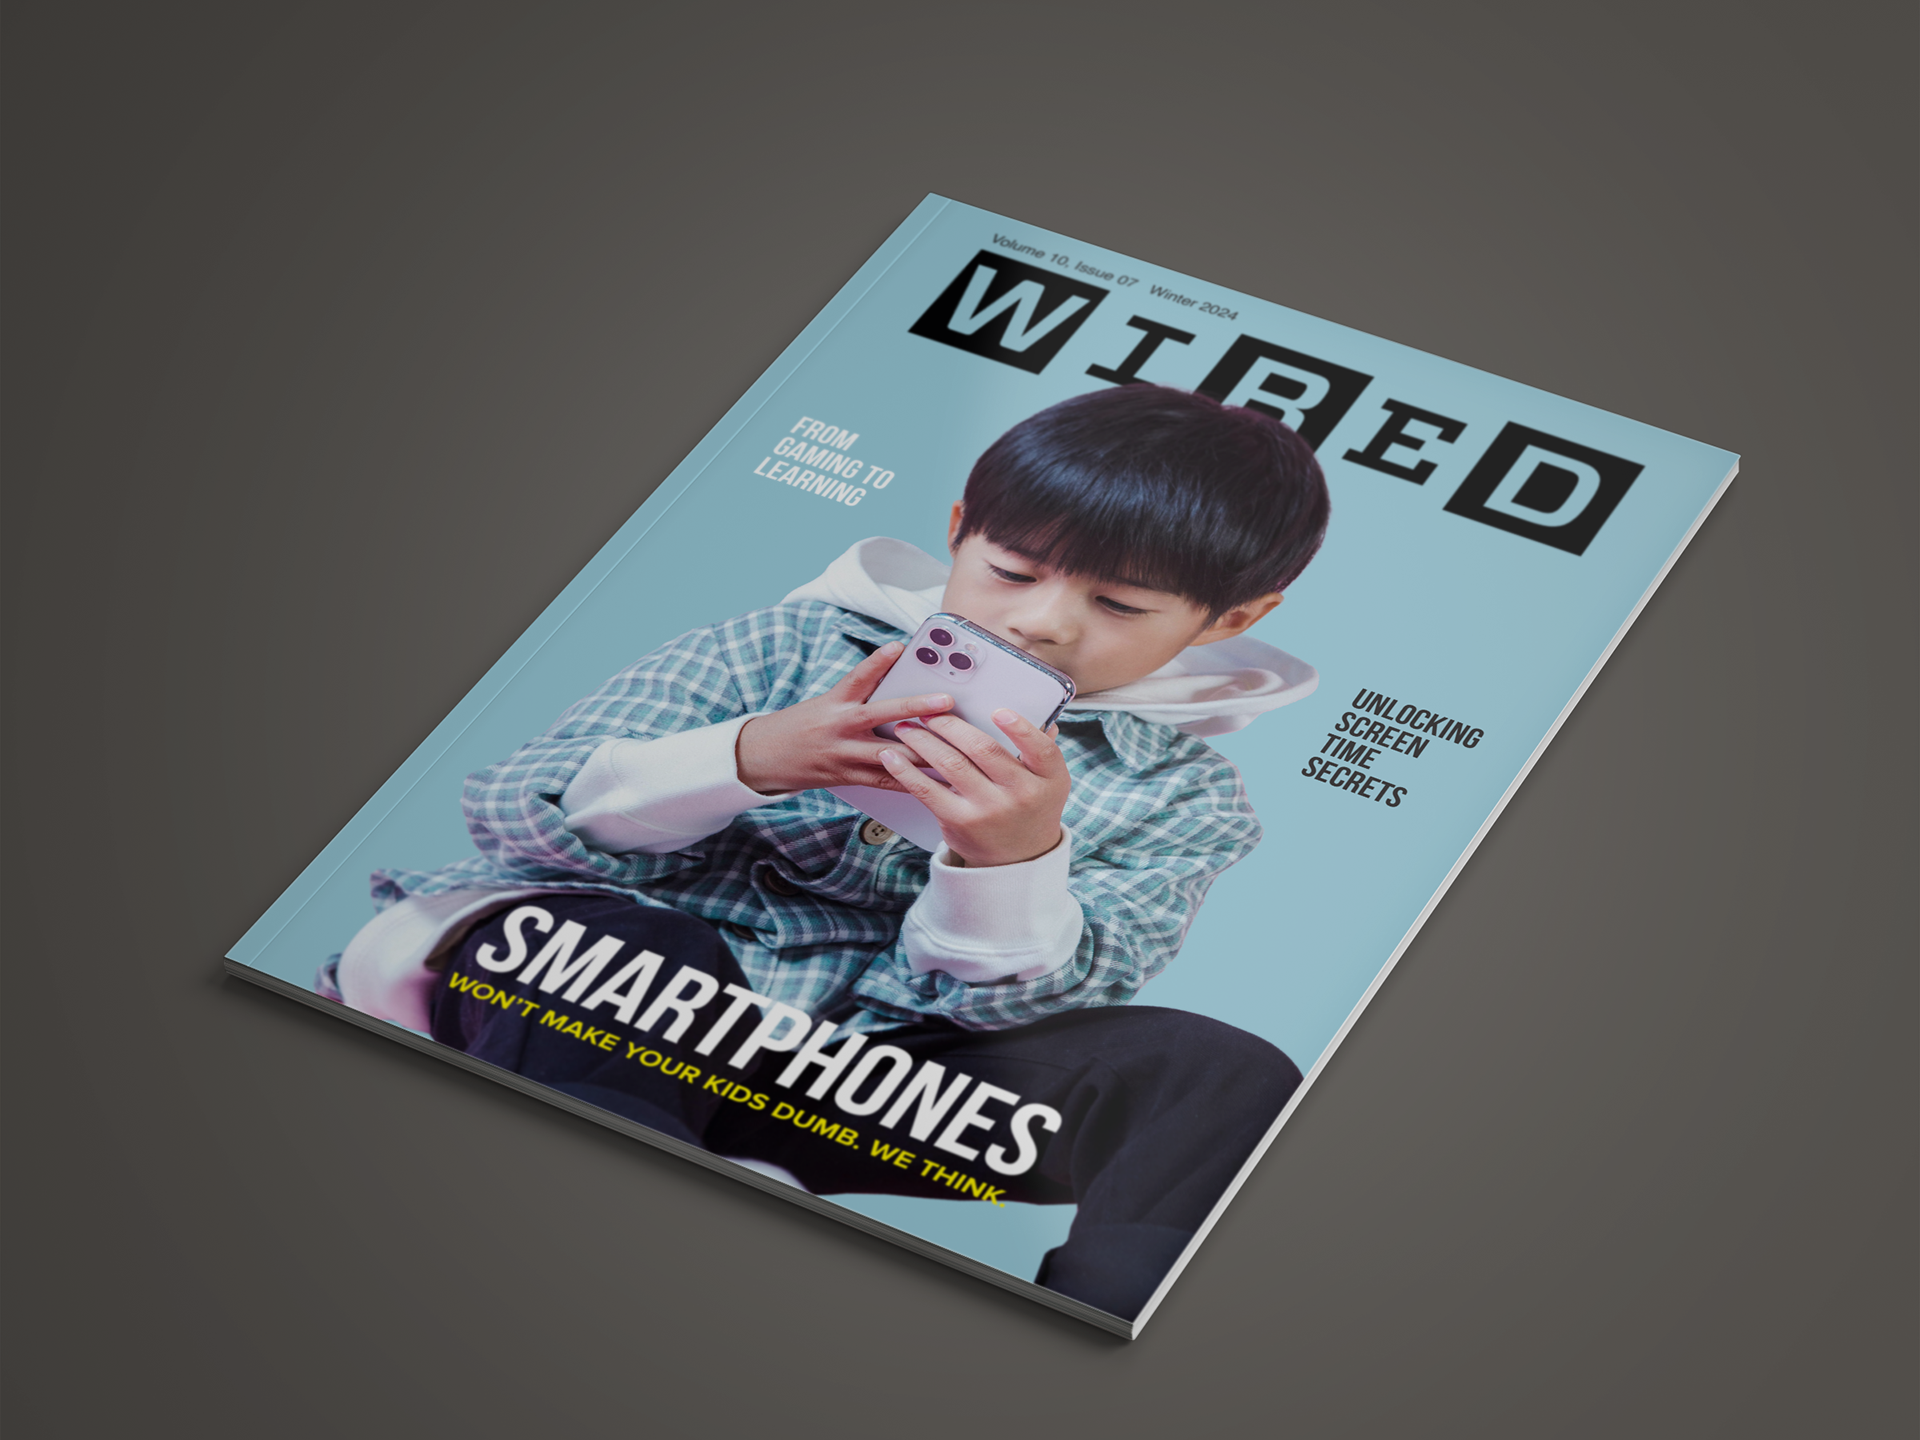
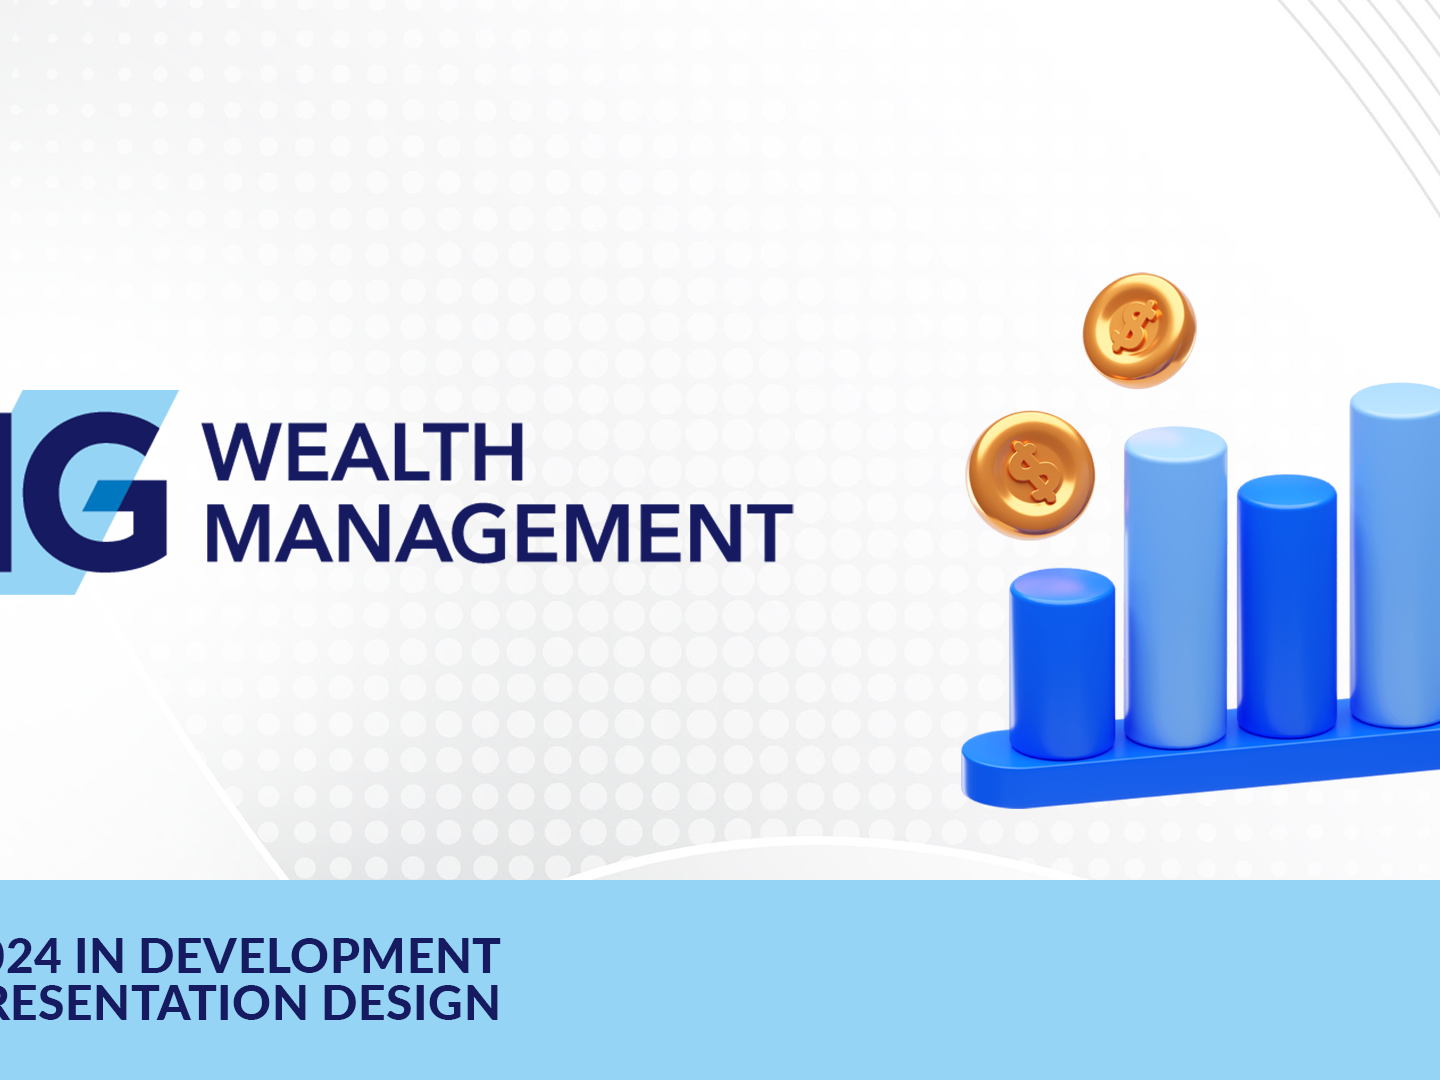
Similar Infographics for other countries